

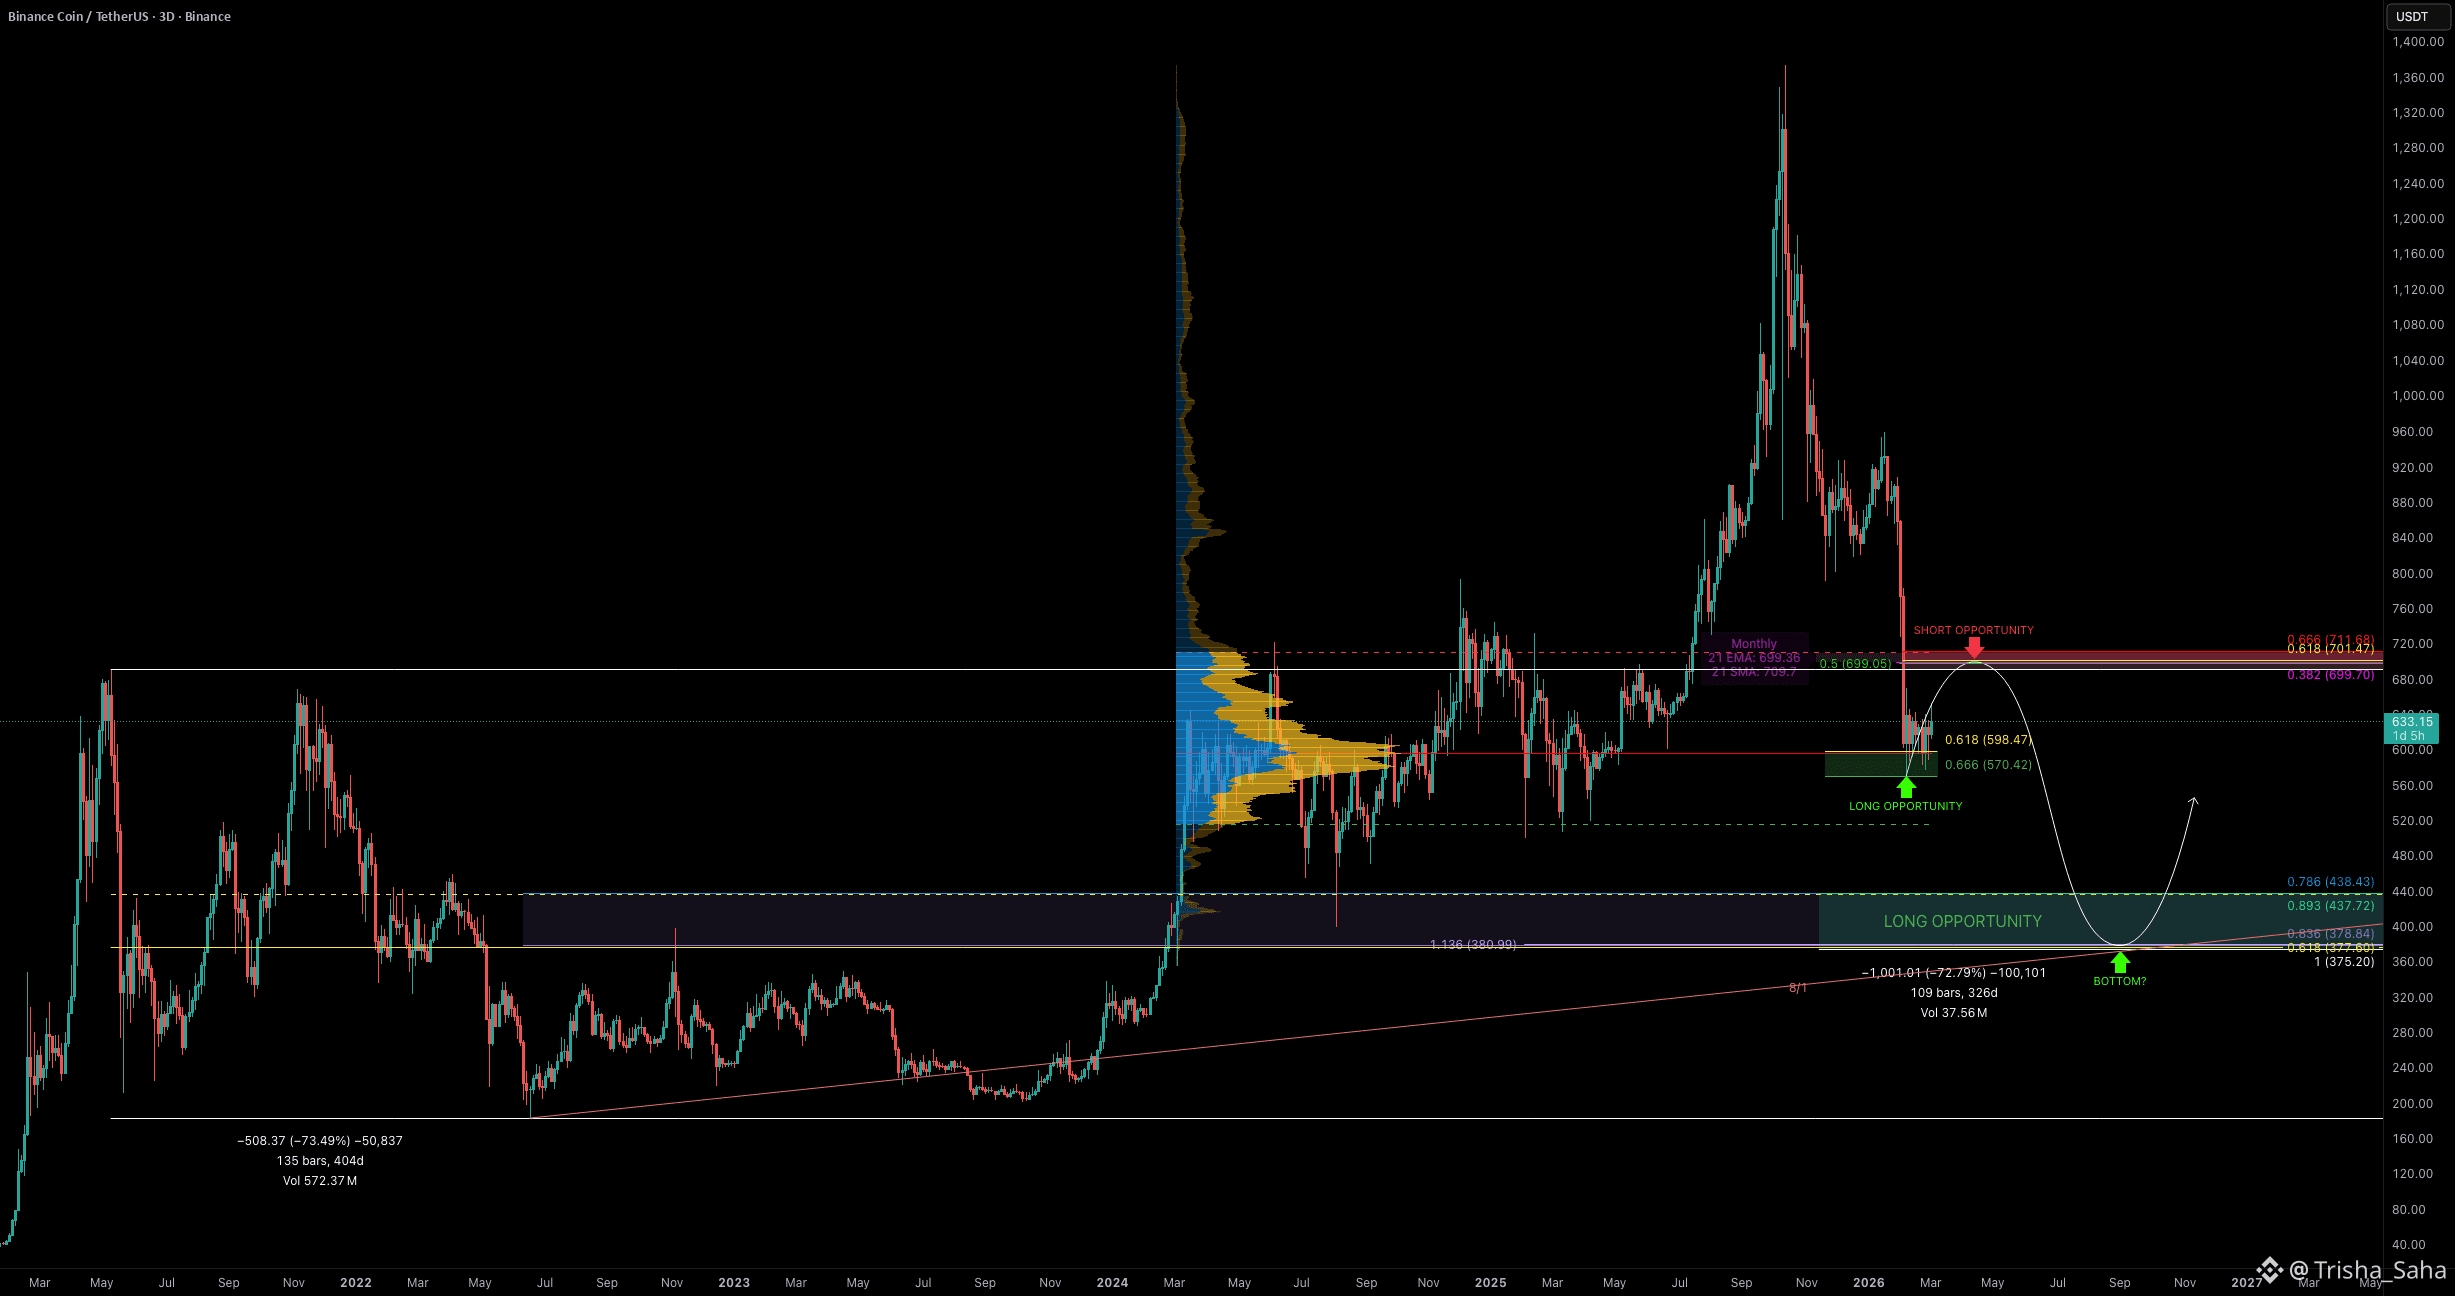
BNB has dropped 58.5% from its all-time high at $1375 down to $570 in just 112 days.
Volume has dried up.
Every rally attempt gets sold immediately.
So far, the bears are fully in control and we have no confirmed reversal signals yet.
With global uncertainty and fear across crypto, the big question is:
Are we close to a bottom or is this just the beginning of a deeper correction?
Historical Context — Do Markets Rhyme?
In the previous bear market, BNB dropped 73.5% from its high.
If markets tend to rhyme, what would that mean now?
A similar percentage decline from $1375 would put price around $375.
Keep that level in mind.
Current Structure
After the aggressive sell-off at the start of the year, BNB found temporary support around the $600 range, where price has been consolidating for roughly a month. This zone aligns with the Golden Pocket of the entire bull market cycle.
But here’s the important lesson:
Not every Golden Pocket is a bottom.
True cycle lows often occur deeper → typically between the 0.786 and 0.886 retracement levels.
Context matters more than a single Fibonacci level.
Key Levels to Watch
Support:
$600 (current range support)
$500 psychological level
Resistance:
$700 (strong Fibonacci confluence + imbalance area)
I would actually prefer to see a move toward $700 first → squeeze late shorts, fill imbalances, trap breakout buyers before continuation lower. That would create a cleaner structure for the next leg down.
Bear Market Target Zone
The high-probability macro bottom area sits between:
$440 – $375
Why this zone?
0.786 retracement of the entire bull cycle: ~$438
1.0 trend-based Fibonacci extension: ~$375
73% total drawdown at $375 (aligns almost perfectly with previous 73.5% bear
market decline)
Coincidence?
Probably not.
Ideal Long Strategy
First serious long interest:
Around $438 (0.786 retracement)
Optimal accumulation zone:
DCA between $440 – $375
If we get a catalyst event between March–September/October that flushes markets, that could be the final capitulation move into this zone.
Market Psychology
Right now:
Momentum is weak
Rallies are sold
Sentiment is fragile
This is not the phase to blindly buy every dip.
This is the phase to:
Improve execution
Study liquidity grabs
Learn day trading
Build capital
Strengthen discipline
Slow markets are where professionals sharpen their edge.
There will be volatility.
There will be fake breakouts.
There will be liquidity sweeps.
Understanding how those moves form is where the real opportunity lies.
Bigger Picture
Until proven otherwise, BNB remains in a controlled downtrend.
But if history rhymes and we see a 73% correction → the $440–$375 zone becomes extremely interesting for long-term positioning.
Patience now could pay heavily later.
_________________________________
🔍 Indicators used
Multi Timeframe 8x MA Support Resistance Zones [SiDec] → to identify support and resistance zones such as the monthly 21 EMA/SMA.
➡️ Available for free. You can find it on my profile under “Scripts” and apply it directly to your charts for extra confluence when planning your trades.
