
The crypto market is flashing strength again. Total market capitalization jumped 5.41% to $2.42 trillion, and Bitcoin (BTC) surged over 7% in the past 24 hours despite ongoing geopolitical tensions in the Middle East.
As of March 4, 2026, $BTC is trading around $71,600, rebounding sharply from a 24-hour low of $66,237. Market cap now stands above $1.43 trillion, supported by positive ETF net inflows over the last two days.
But beyond the short-term bounce, a much bigger narrative is unfolding on the weekly chart.
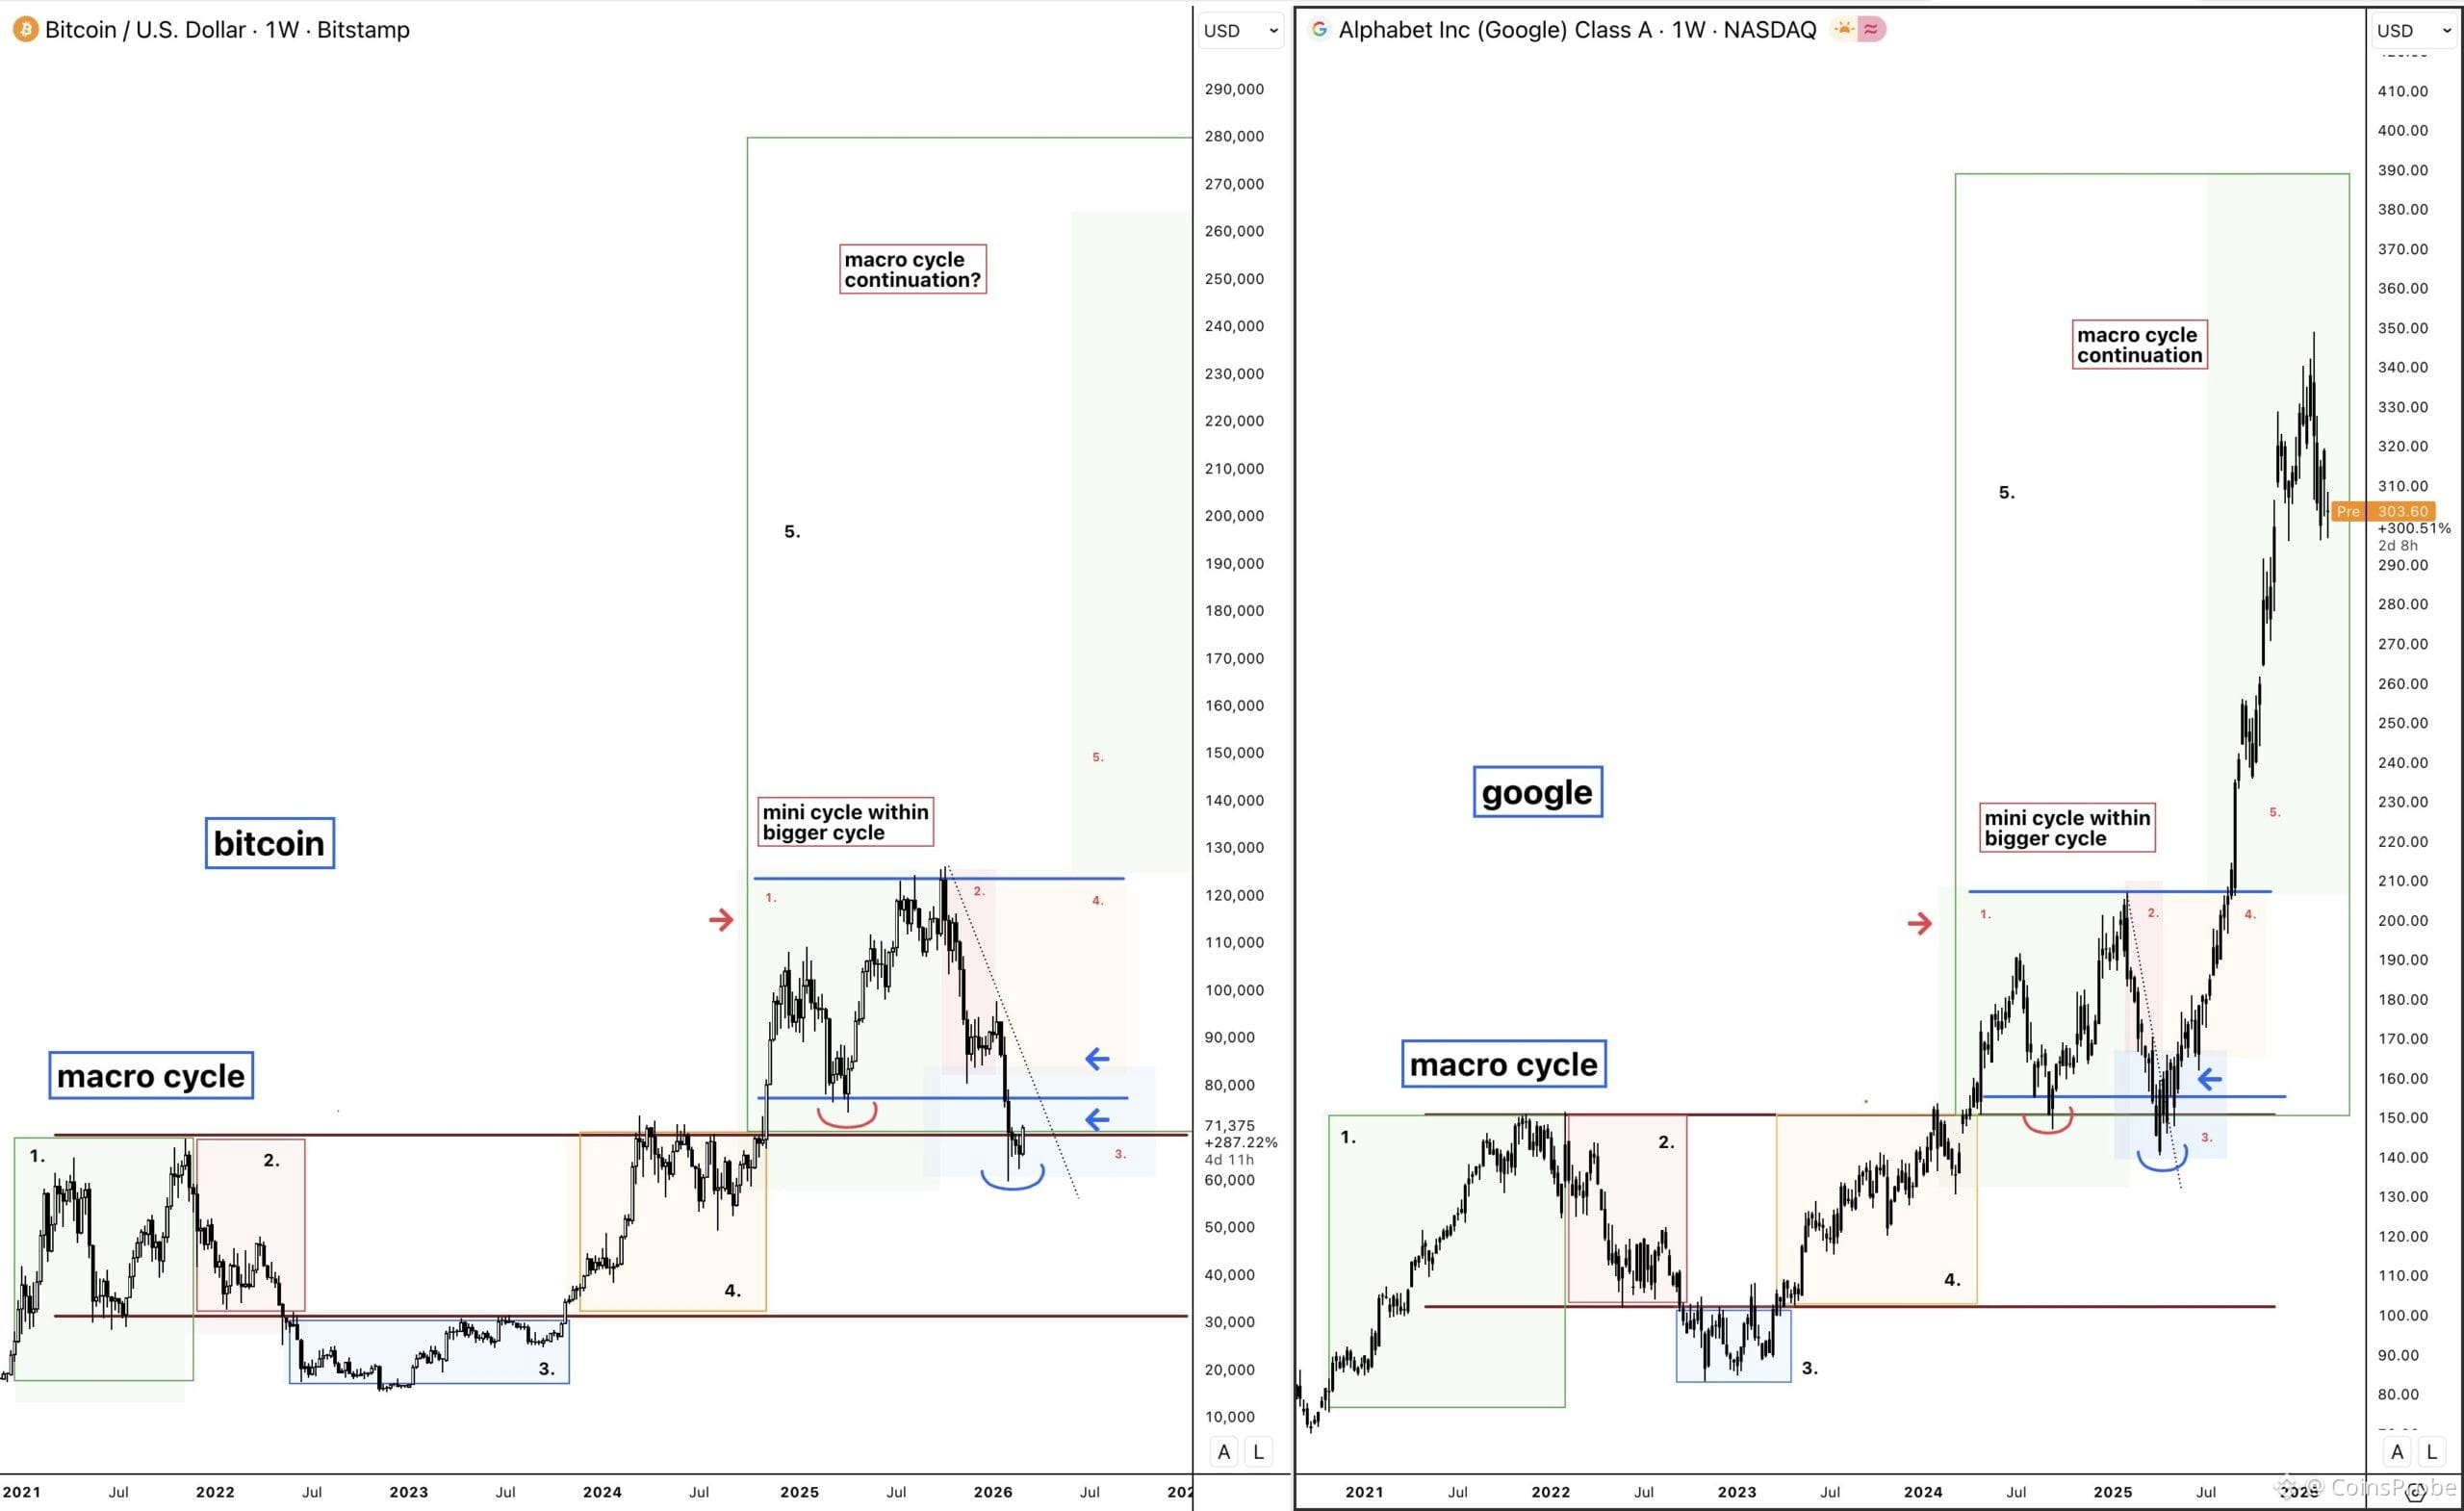
According to prominent analyst CryptoAmsterdam, Bitcoin’s current structure is closely mirroring the historical macro setup of Alphabet Inc. (Google) before its explosive continuation rally.
BTC Mirrors Alphabet’s Macro Fractal
The comparison highlights a repeating structure:
Macro cycle → Breakout → Mini cycle retest → Continuation of macro trend
On the left side of the chart, Bitcoin shows a completed macro cycle between 2021 and 2023, followed by a breakout in 2024. After that breakout, BTC entered a consolidation phase — a “mini cycle within the bigger cycle” — forming a corrective structure inside a descending channel.
 Credits: @damskotrades (X)
Interestingly, Alphabet Inc. (GOOG) displayed almost the same behavior during its 2022–2024 structure:
Large macro accumulation
Breakout above resistance
Pullback to key structural level
Strong continuation phase
Once Google reclaimed its key breakout level, the stock advanced aggressively from the $140 area to nearly $340 — a massive macro continuation move.
Now Bitcoin appears to be printing a similar roadmap.
The $60K Defense: A Critical Moment
Last month, BTC dipped toward the $60,000 region — aligning with the lower boundary of its macro structure. Instead of collapsing, price held firm and quickly reclaimed $70K.
This defense resembles Google’s historical pullback before continuation. In both cases:
The lower macro support held.
Sellers failed to break structure decisively.
Price began reclaiming key horizontal levels.
On the Bitcoin chart, the descending corrective channel is compressing toward resistance. That typically precedes expansion — especially if it aligns with a higher timeframe macro continuation.
What Needs to Happen Next?
For this fractal to fully validate, two key confirmations are required:
• Trendline break near $79,000
A decisive weekly close above the descending channel resistance would confirm breakout strength.
• Reclaim of major structural level near $126,000
This is the bigger macro trigger. A sustained move above this zone would likely confirm a new expansion leg similar to Google’s macro continuation phase.
If those conditions are met, the probability of a powerful upside expansion increases significantly.
While fractals are never guarantees, they offer high-probability roadmaps when macro structure aligns. What makes this setup compelling is the combination of:
Bitcoin has already shown resilience amid geopolitical volatility. If it continues holding above $70K and breaks $79K with strength, the narrative could quickly shift from “relief bounce” to “macro continuation.”
For now, the structure favors expansion — but confirmation is everything.
The next few weekly closes may determine whether Bitcoin is simply bouncing… or preparing for its next historic leg higher.
Disclaimer: The views and analysis presented in this article are for informational purposes only and reflect the author’s perspective, not financial advice. Technical patterns and indicators discussed are subject to market volatility and may or may not yield the anticipated results. Investors are advised to exercise caution, conduct independent research, and make decisions aligned with their individual risk tolerance.