Here’s a technical analysis of $WLD @Worldcoin (weekly timeframe):
Chart Pattern:
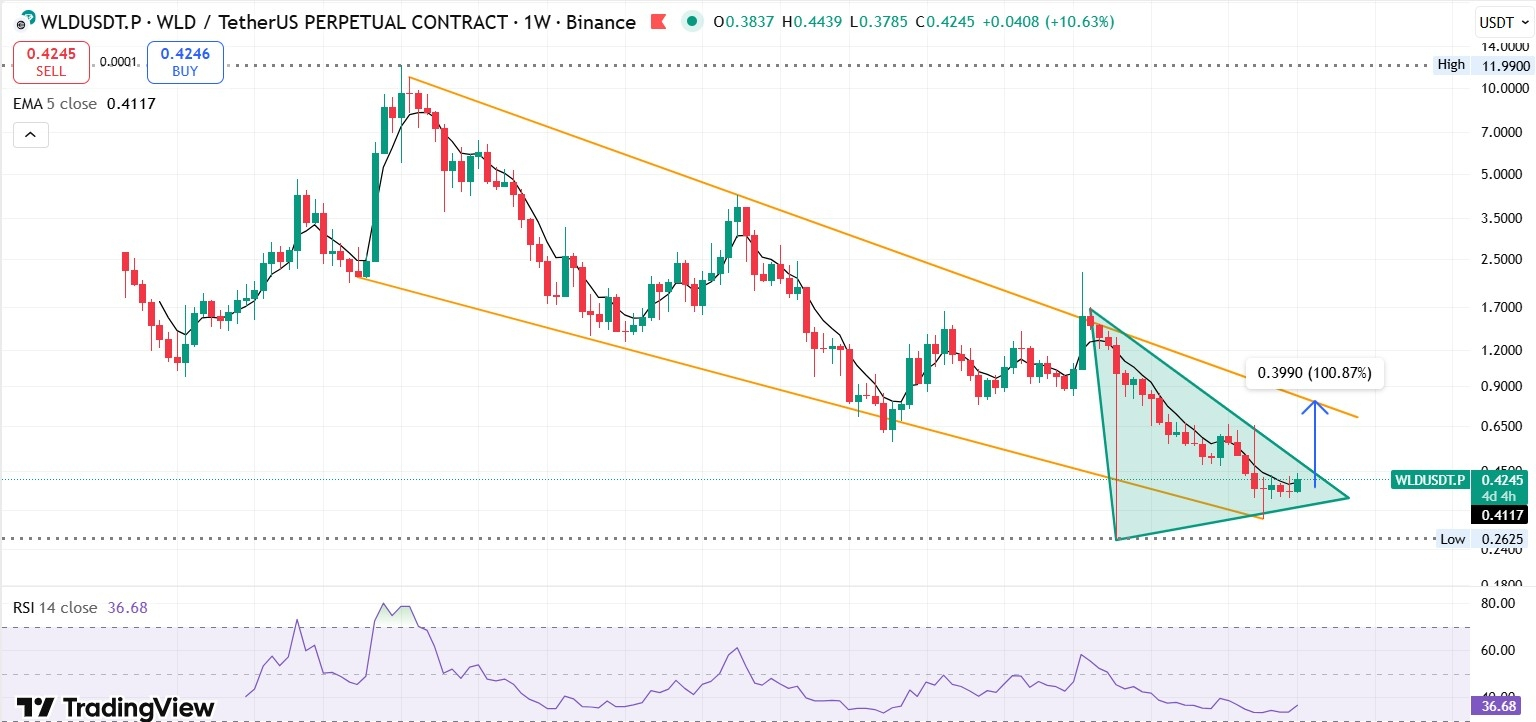
The chart shows a descending wedge pattern forming over the longer-term downtrend.
The recent price action is forming a symmetrical triangle within the wedge, indicating consolidation.
The wedge is marked by two converging orange trendlines, while the triangle is shaded in green.
Key Levels:
Support: $0.2625 (recent lows)
Resistance: $0.65–0.70 (upper trendline of wedge)
Current price: $0.4245, slightly above the 5-week EMA (0.4117)
RSI (14): 36.68 – showing slight oversold conditions, which suggests a potential bullish reversal.
EMA (5-week): Price crossing above EMA is a minor bullish signal.
Potential Move: Breakout from the triangle could lead to a 100% projected upside
$0.399–$0.42
Long-term downtrend is still intact until the price decisively breaks the upper wedge line.
#WLD #Worldcoin is consolidating and showing signs of potential bullish reversal from oversold conditions.
Breakout above the triangle for confirmation, with upside targets near $0.65–$0.80.
RSI indicates buyers could step in, but caution is advised as the broader downtrend is not fully broken. #BinanceSquare #BinanceSquareFamily #BinanceSquareTalks