📊 ZEC/USDT Daily Market Analysis
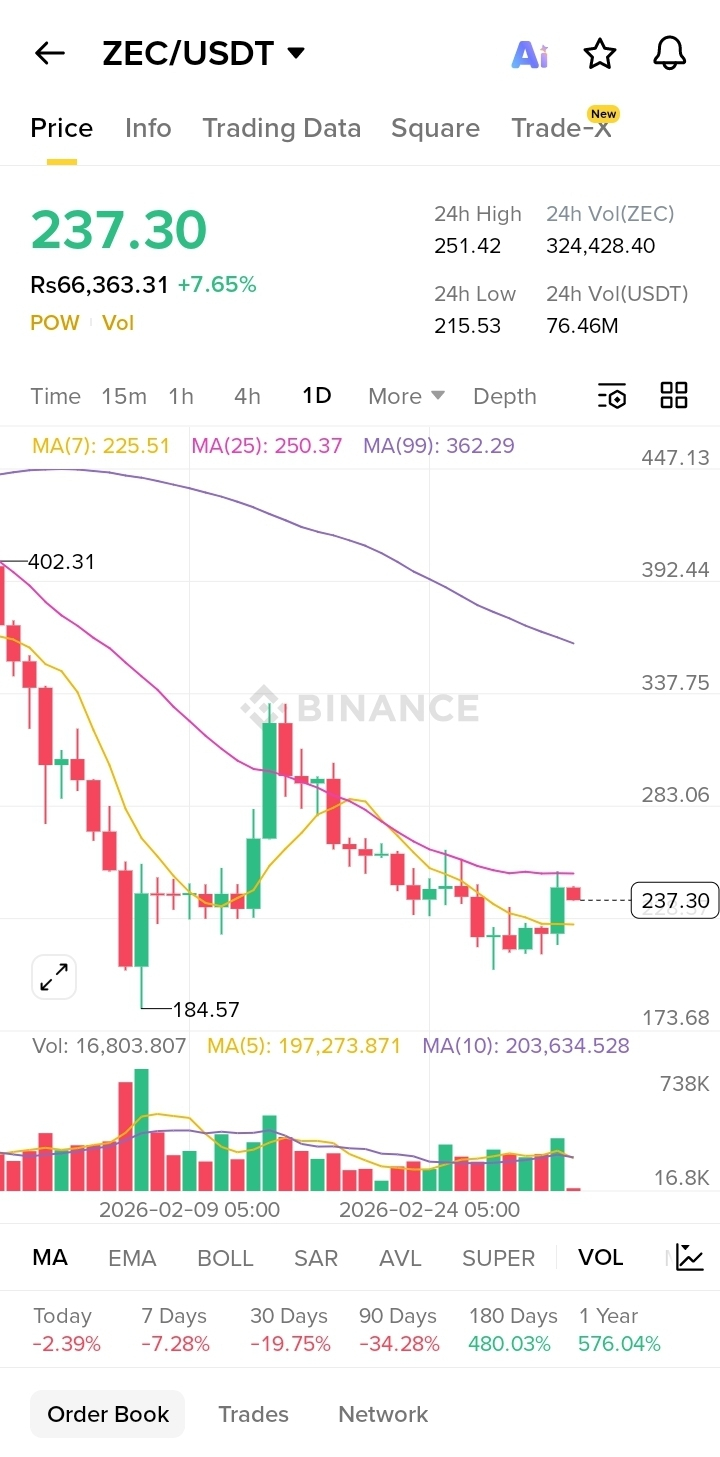
ZEC is currently trading around $237, showing a +7.6% daily gain and strong short-term recovery from the recent support zone near $215.
🔍 Technical Overview
• Trend: The daily chart still shows a broader downtrend, but price is attempting a short-term rebound.
• MA Levels:
MA(7): $225 – Price trading above it (short-term bullish).
MA(25): $250 – Acting as immediate resistance.
MA(99): $362 – Indicates the long-term trend is still bearish.
📈 Key Levels to Watch
Support:
• $225
• $215
• $200
Resistance:
• $250
• $283
• $337
⚡ Trading Scenario
• If ZEC breaks above $250, we could see momentum toward $280-$300.
• If price fails to hold $225, a retest of $215 support is possible.
📊 Volume Insight
Recent candles show increasing buying volume, suggesting buyers are attempting to regain control after the recent downtrend.
💡 Trader Tip
Wait for a clear breakout or support confirmation before entering trades to reduce risk.
⚠️ This analysis is for educational purposes only and not financial advice. Always manage your risk.#zec