Solana (SOL/USDT) Daily Chart Analysis – 1D
Market Trend: Bearish to Neutral
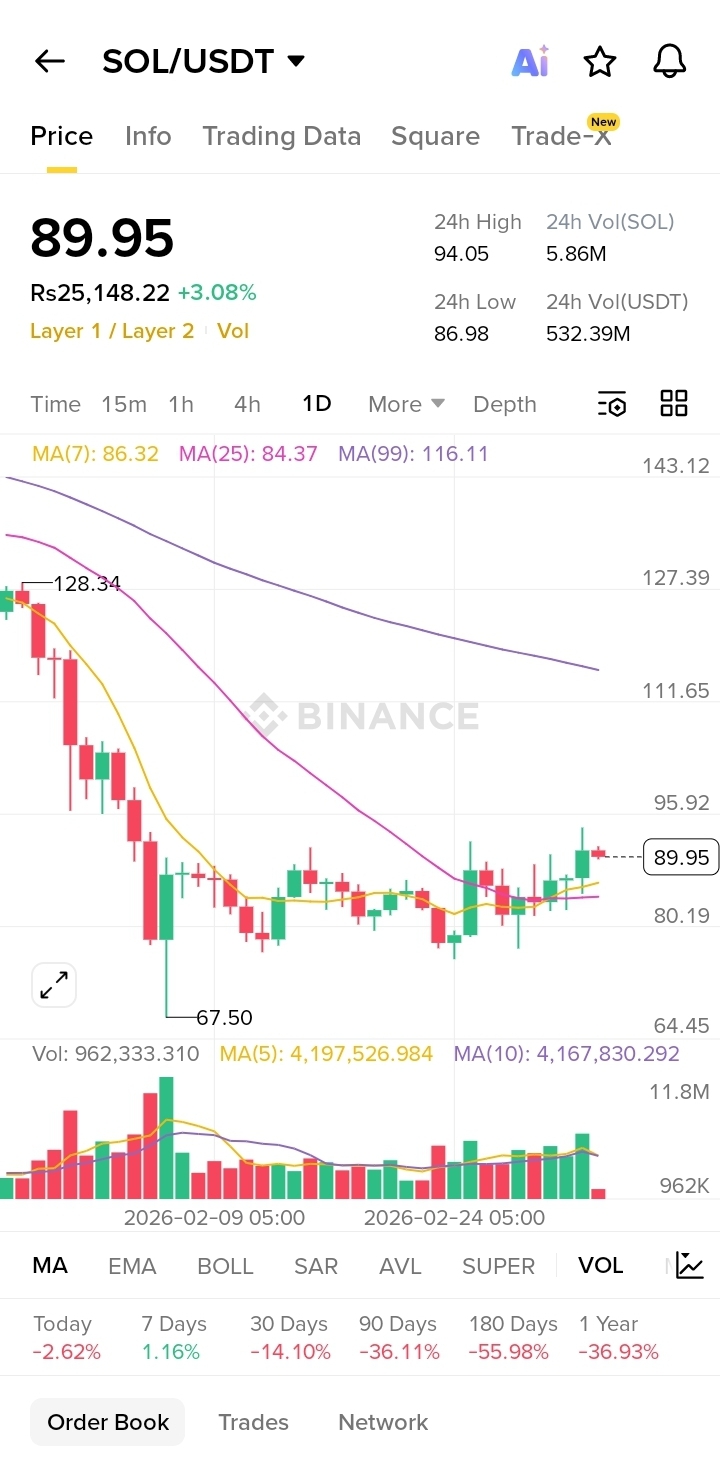
Timeframe: 1 Day (1D)
Overview:
On the daily timeframe, SOL is currently trading in a descending trend, with price remaining below major moving averages. Sellers still dominate the market, but the RSI indicates oversold conditions, meaning a short-term bounce could occur if buyers step in. �
CoinLore
Key Support Levels
$78 – $76 → Immediate support zone
$73 – $70 → Strong support area
$67 – $60 → Major demand zone if breakdown occurs �
CoinLore +1
Key Resistance Levels
$81 – $85 → First resistance area
$88 – $90 → Breakout confirmation zone
$96 – $105 → Bullish continuation target �
CoinStats +1
Indicator Signals
RSI: Oversold zone → Possible relief bounce
MACD: Weak momentum, no strong reversal yet
Trend: Price below 50 & 200 MA → Bearish structure �
CoinLore
Possible Scenarios
Bullish Scenario:
If SOL holds above $78 support, a recovery move toward $88–$96 could happen.
Bearish Scenario:
If $78 support breaks, price may drop toward $70 or even $60 demand zone.
Trader Strategy
Short-term traders: Watch for bounce near support zones.
Breakout traders: Wait for a strong daily close above $90 for bullish confirmation.
⚠️ Disclaimer: This analysis is for educational purposes only. Always manage risk and do your own research before trading.#solana