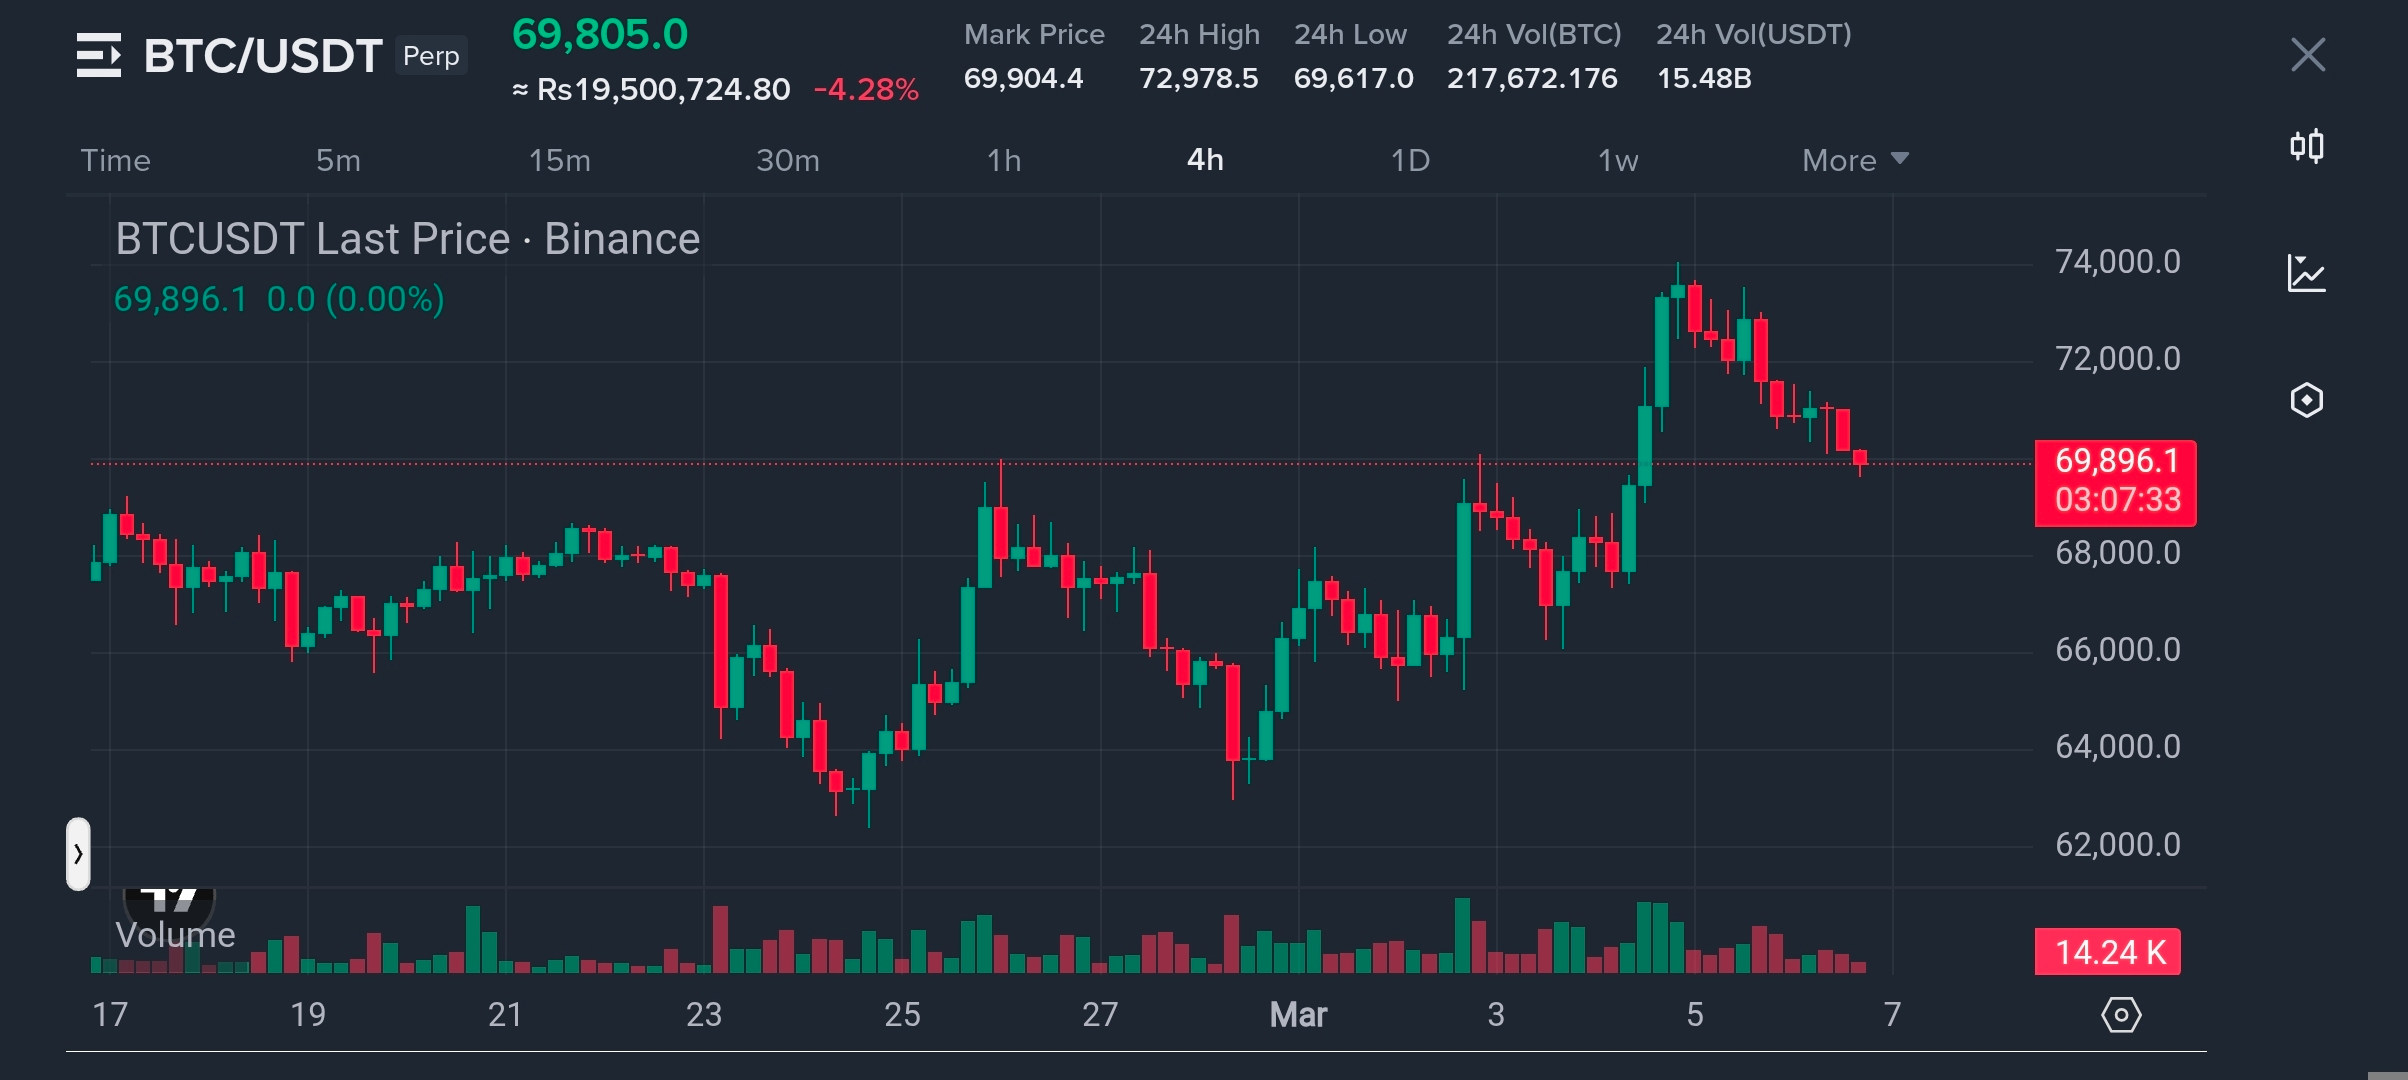
The Bitcoin #BTC chart on the 4-hour (4H) timeframe is currently showing some intense price action. After hitting a local peak near $73,000, we are seeing a healthy retracement. BTC is currently hovering around the $69,800 mark, and the next few candles will be crucial for determining the short-term trend.
 BTC67,305.8-0.75%
🔍 Technical Breakdown (4H Timeframe)
Looking at the candlestick patterns, Bitcoin #BTC recently experienced a "Double Top" rejection near the $73k resistance zone. This has led to a series of red candles, pushing the price back toward a previous support-turned-resistance level.
Bearish Sentiment: The immediate momentum is downward. If B#BTC fails to hold the $69,000 - $69,500 support zone, we could see a slide toward the $67,200 level.
Bullish Sentiment: If the current level holds and we see a strong bounce with high volume, #BTC might attempt to reclaim $71,500 before making another run for a new all-time high.
📉 Trade Setup: Short-Term Outlook
Based on the current downward pressure shown in the 4H chart.
Trade Type: Short (Scalp/Day Trade)
Entry Zone: $69,900 - $70,200 (Wait for a retest of resistance)
Take Profit 1: $68,500
Take Profit 2: $67,300
Stop Loss: $71,800 (Above the recent swing high)
Note: If you prefer a Long position, wait for a confirmed breakout and candle close above $72,000.
⚠️ Risk Warning
Crypto markets are highly volatile. This analysis is based on current chart patterns and is for educational purposes only. Always use proper risk management and never risk more than you can afford to lose. DYOR (Do Your Own Research)
$BTC #Bitcoin #CryptoAnalysis #BinanceSquare #TradingSignals