Here’s a concise summary of the ZECUSDT Perpetual futures chart with only the essential points:
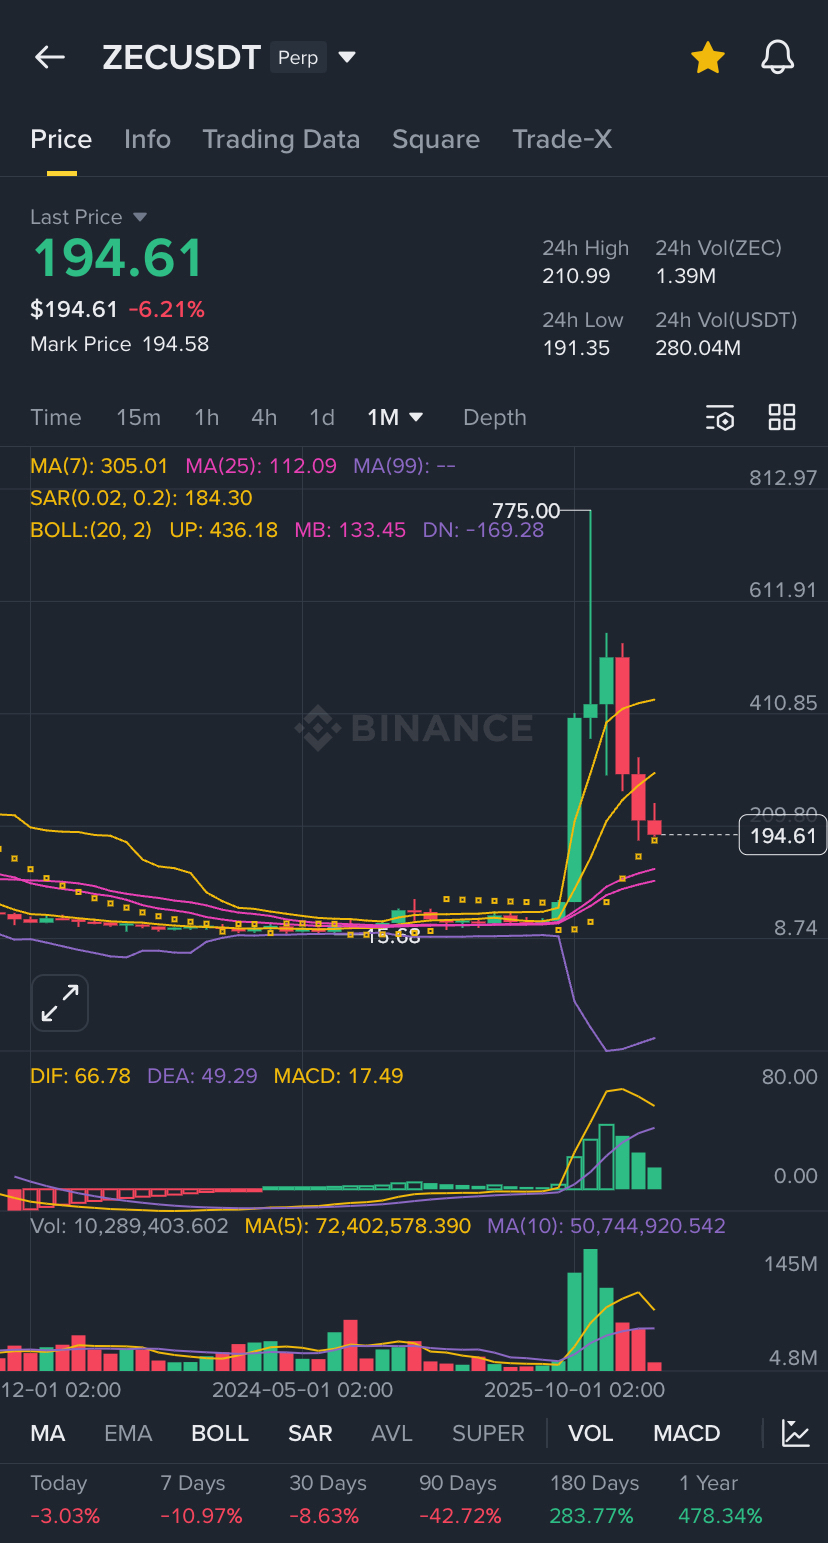
• Current Price: ≈ $194.61 (down -6.21% in the last 24 hours).
• Mark Price: ≈ $194.58 (very close to last price, minimal funding/ premium skew).
• 24h Range: High $210.99 → Low $191.35.
• 24h Volume: ≈ 1.39M ZEC (~$280M USDT equivalent) — elevated activity during the move.
• Recent Price Action (1M timeframe shown): Sharp parabolic surge from lows around $15–$16 (early in the period) to a peak near $775–$812, followed by a strong correction/pullback. Price now retesting near the $200 horizontal level (noted as a potential support/former breakout area around $200.80–$209.80).
• Key Technical Indicators:
• Moving Averages — Price well below short-term MAs (e.g., MA(7): ~$305, MA(25): ~$112), indicating bearish momentum in the pullback.
• Bollinger Bands (20,2) — Extremely wide expansion during the rally (upper ~$436, lower deeply negative due to scaling); current price near/ below middle band (~$133).
• MACD — Positive (DIF 66.78 > DEA 49.29, MACD histogram 17.49), but likely rolling over after the parabolic top (histogram bars shrinking).
• Parabolic SAR — Currently above price at ~$184, confirming short-term bearish trend.
• Performance Overview (various timeframes):
• Today: -3.03%
• 7 Days: -10.97%
• 30 Days: -8.63%
• 90 Days: -42.72%
• 180 Days: +283.77%
• 1 Year: +478.34% (strong longer-term uptrend despite recent correction).
Overall: ZEC experienced a massive explosive rally (likely driven by broader market momentum or privacy coin narrative), but is now in a deep correction phase (-6%+ daily, multi-week pullback from highs). Price is holding around $194–$200 support for now, but below key MAs and with bearish SAR, risks further downside unless it reclaims higher levels quickly. This is typical post-parabolic consolidation in altcoins.