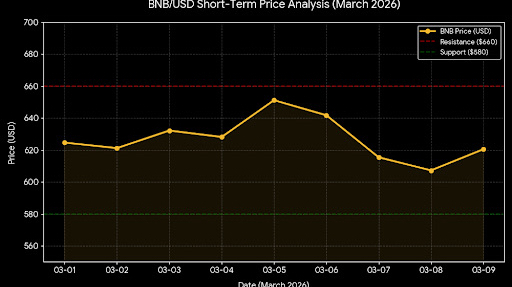
📊 Analiza ceny BNB & Wykres
Na podstawie danych z 8 marca, $BNB obecnie handluje w okolicach $614.97, walcząc o utrzymanie kluczowego poziomu wsparcia. Wykres dzienny pokazuje wzór konsolidacji między $607 a $624, z osłabioną dynamiką trendu odzwierciedloną w niższych wolumenach handlowych.
📈 Kluczowe poziomy techniczne
· Krytyczne wsparcie: $614.46. To jest najważniejszy poziom do obserwacji; przełamanie poniżej tego poziomu może wywołać spadek w kierunku zakresu $550-$580.
· Natychmiastowy opór: $624.02. Wybicie powyżej tego poziomu to pierwszy znak siły.
· Główny cel wzrostu: 653,50 USD (zbieżny z 20-dniową EMA i górnym pasmem Bollingera). Przełamanie powyżej tego poziomu otwiera drzwi do przedziału celów analityków 667-670 USD.
🧐 Prognoza rynkowa
· Mieszane sygnały: Codzienny RSI jest neutralny na poziomie 41,39, sugerując przestrzeń do ruchu, podczas gdy MACD pokazuje słaby sygnał kupna. Jednak cena pozostaje poniżej kluczowych średnich kroczących, potwierdzając krótkoterminowy trend spadkowy.
· Tendencja handlowa: Ogólne nastawienie rynku jest ostrożne, a analitycy widzą 55% prawdopodobieństwo dalszego spadku w porównaniu do 45% szansy na wzrost. Przełamanie powyżej 624 USD jest potrzebne dla byków, podczas gdy spadek poniżej 614 USD prawdopodobnie zaprosi do większej presji sprzedażowej.#MarketPullback #AIBinance #bnb一輩子 #BNB_Market_Update #BNB金鏟子