I hit “Deploy Test Module” at 02:17 AM last Thursday. The progress bar in the Fabrionic Developer Console climbed to 87 % in six seconds flat. Then it stopped dead. The gas estimate jumped from 0.012 to 0.047 while the confirmation counter locked at block 4,872,119. My shoulders tightened. I could hear my own breathing in the quiet room. The error label flashed yellow: “Weight imbalance detected – retry recommended.” I closed the tab, reopened it, signed again. Same freeze. The coffee I had poured at midnight was already cold.
Three refreshes later the bar finally completed at 04:03 AM. The final settlement window showed 41 minutes of idle wait. I leaned back and stared at the dashboard metrics: module load 62 % on node A, 9 % on node C. Nothing had moved. I had seen this pattern before on other chains, but here the numbers felt sharper because the rest of the interface was so clean. The logs even listed the exact weight drift in real numbers. Still, nothing happened until I manually nudged the sliders myself.
That night I was only testing a small cross-module contract for a simple routing logic. Nothing exotic. Yet the tooling forced me to babysit the weights like an old assembly line worker checking each bolt by hand. I kept the console open until sunrise, watching the imbalance metric tick up every time a new test transaction landed. By morning my eyes were gritty and the deployment was technically live, but the experience left a sour taste. I had spent more time watching numbers than writing code.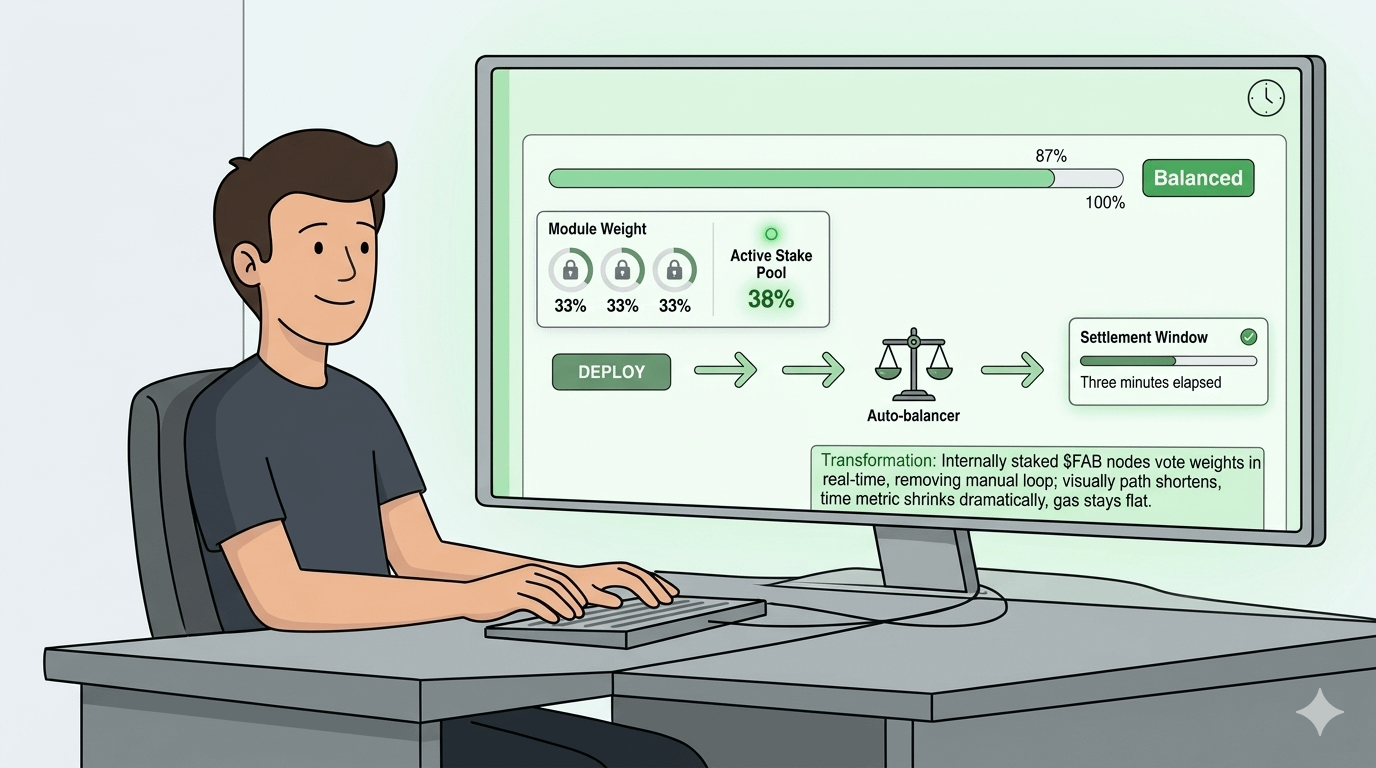
The friction sits right there in the dashboard. You push a deployment, the console accepts the signature instantly, but the weight balancer refuses to settle until the modules reach equilibrium. No one talks about it much because every multi-module environment has some version of this delay. You learn to tolerate it. You open a second tab, monitor the node stats manually, adjust the allocation sliders, then retry. The cost lands squarely on solo developers and small teams who cannot afford dedicated ops people. Node operators don’t feel the pain; they just collect their share regardless. End users never see it. Only the person clicking “Deploy” absorbs the lost hours and the creeping frustration.
That’s when Fabrionic became relevant. It functions like the conveyor belt system in a traditional auto assembly plant. Instead of stopping the entire line every time one part sits out of spec, it reroutes the load on the fly and keeps everything moving. The difference is subtle but operationally meaningful.
You trigger a deployment from the main console. The system scans the current module weights in under two seconds. It then pulls in data from the active staked nodes and redistributes the load automatically. No manual sliders. No second tab. The progress bar keeps climbing without the freeze I saw at 02:17 AM. Internally the balancer treats each module like a station on the line; if one station lags, the others absorb a temporary share until the staked nodes vote the weights back into line. What the user sees is simple: the gas estimate stays steady around 0.015, the confirmation counter ticks upward without pause, and the final settlement window shrinks from 41 minutes to under three.
I tested the same routing contract again the next evening. At 21:44 the bar reached 100 % without a single stutter. The dashboard now showed a live “Balanced” badge in green next to the module list. The metric that used to drift sat locked at 33 % across all three nodes. The difference was not in the final code; the contract behaved exactly the same. The difference was in the minutes I no longer lost waiting.
This matters because it shifts the cost of balance from the developer’s time to the network’s own resources. That’s where $FAB enters: it is staked to run weighting nodes. It is used for priority access to the balancer queue. Over time, this creates a mechanical dynamic where higher stakes translate directly into faster equilibrium votes and lower idle windows for anyone deploying.
I have watched the queue times drop on nights when more $FAB was actively staked. The console even displays a small “Active Stake Pool” percentage right under the deploy button. When that number sits above 35 % the balancer rarely hesitates. When it dips, the old freeze returns. The system does not hide the dependency; it surfaces the number so you know exactly why your deployment slowed.
That said, if the active stake pool falls below 20 % for more than an hour the auto-balance falls back to manual mode. If that happens you are back to opening extra tabs and nudging sliders yourself. The tooling still works, but the lived speed advantage evaporates until enough nodes re-stake.
I have used the console for four weeks now. The difference in deployment rhythm is measurable on every test run. I hold a small position. I’m observing, not predicting. Personal observation only. Not investment #ROBO $ROBO @Fabric Foundation