Is Ethereum finally ready to break its chains, or is the market just teasing us?
After a spirited sprint to a monthly high of $2,209, ETH has hit a familiar ceiling. It’s a level we’ve seen tested—and rejected—five times since February. While the bulls are staring longingly at the next major milestone, the data suggests that the "smart money" and the "fast money" are currently reading two different scripts.
If you’re wondering whether this retracement is a healthy breather or a warning sign, let’s dive into the mechanics of what’s actually happening under the hood.
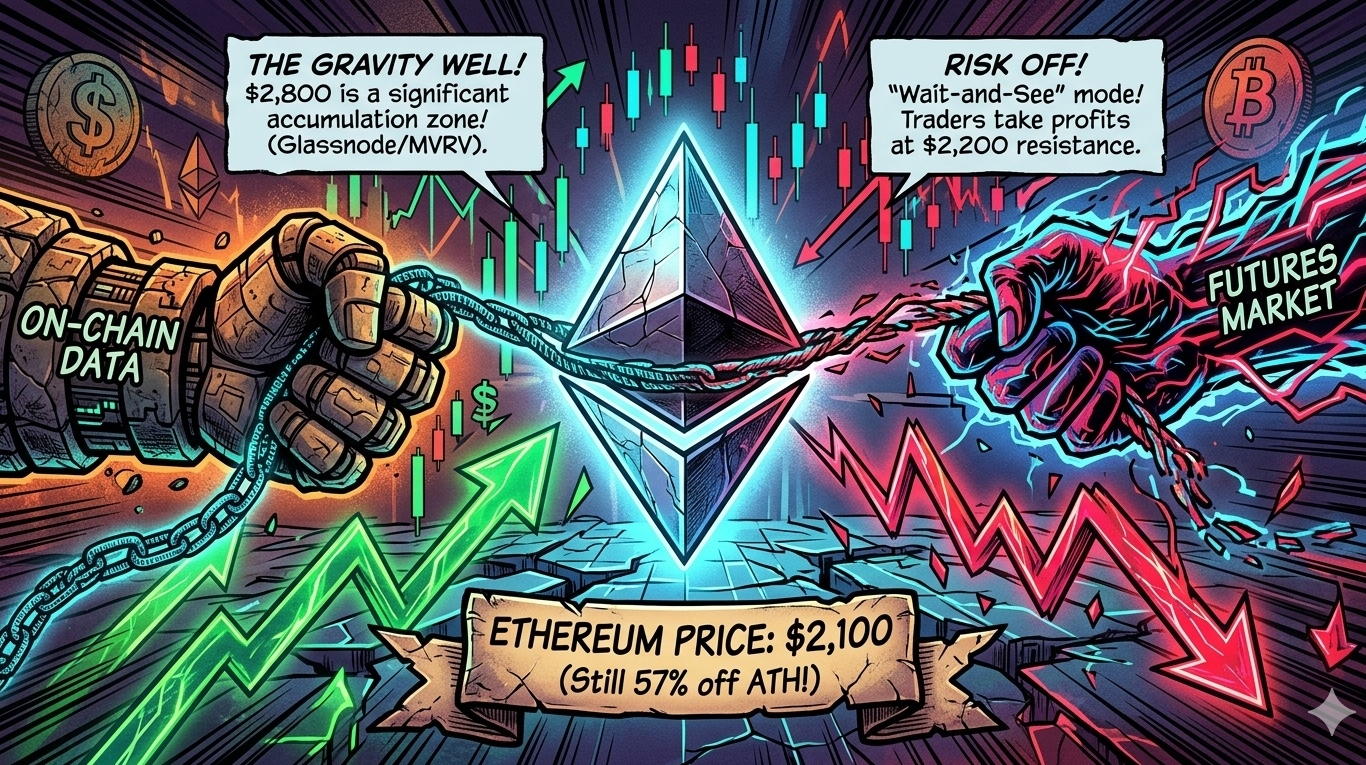
The On-Chain Magnet: Why $2,800 Matters
When we look at Glassnode’s cost basis distribution, something fascinating emerges. There is a massive accumulation cluster of over 3 million ETH sitting near the $2,800 mark.
In crypto, we call these "gravity zones." Here’s why they matter:
• The Psychological Floor: Investors who entered at $2,800 often defend those positions vigorously.
• The Path of Least Resistance: Between our current price and that $2,800 level, the supply structure is surprisingly thin.
• The Technical Confluence: The 200-day Simple Moving Average (SMA) is also hovering near $2,800—a level ETH hasn't sniffed since early January.
Essentially, if Ethereum can decisively flip $2,200 into support, there isn't much "historical congestion" to stop a run toward $2,800. But—and it’s a big but—on-chain maps only show us the destination; they don't provide the fuel.
The Futures Reality Check: Caution Over Conviction
While on-chain data looks like a green light, the derivatives market is flashing a yellow one.
During the recent rally, Open Interest (OI) surged by 21%, swelling to $10.9 billion. This tells us that traders were aggressively using leverage to ride the wave up. However, as soon as we touched that upper resistance, OI dropped by 6%.
The takeaway? Traders aren't "mooning" just yet. Instead of doubling down at the breakout point, they chose to take profits and de-risk.
Furthermore, the Spot Cumulative Trade Volume Delta (CVD)—a fancy way of measuring buying vs. selling pressure—showed that while buyers were hungry at $2,000, that appetite vanished as we approached $2,150. Right now, the market is sitting in a "balanced" state (about 59.4% long on Binance). In trading lingo, a balanced market at the top of a range usually leads to "noise" and volatility rather than a clean, explosive breakout.
The Bottom Line
We are currently witnessing a classic standoff.
• On-chain data says the structural target is $2,800.
• Futures data says the market isn't ready to commit the capital to get there.
As of today, ETH is trading around $2,100—still roughly 57% off its August 2025 all-time high of $4,952. The $2,800 target is valid, but until we see sustained spot demand and a willingness from the derivatives market to hold through resistance, it remains a "distant destination."
What’s your move? Are you filling your bags in anticipation of the $2,800 "gravity zone," or are you playing it safe until we see a confirmed daily close above $2,200? Drop your thesis in the comments—let’s talk strategy!
Looking for more alpha?
• Read: Druckenmiller Predicts Stablecoins Will Dominate Global Payments
• Read: The Unlikely Rise Of The World's Largest Prediction Market
Would you like me to analyze the recent liquidations data to see where the "pain point" for the next price move might be?
#ETH #PCEMarketWatch #BinanceTGEUP #BTCReclaims70k #Write2Earn