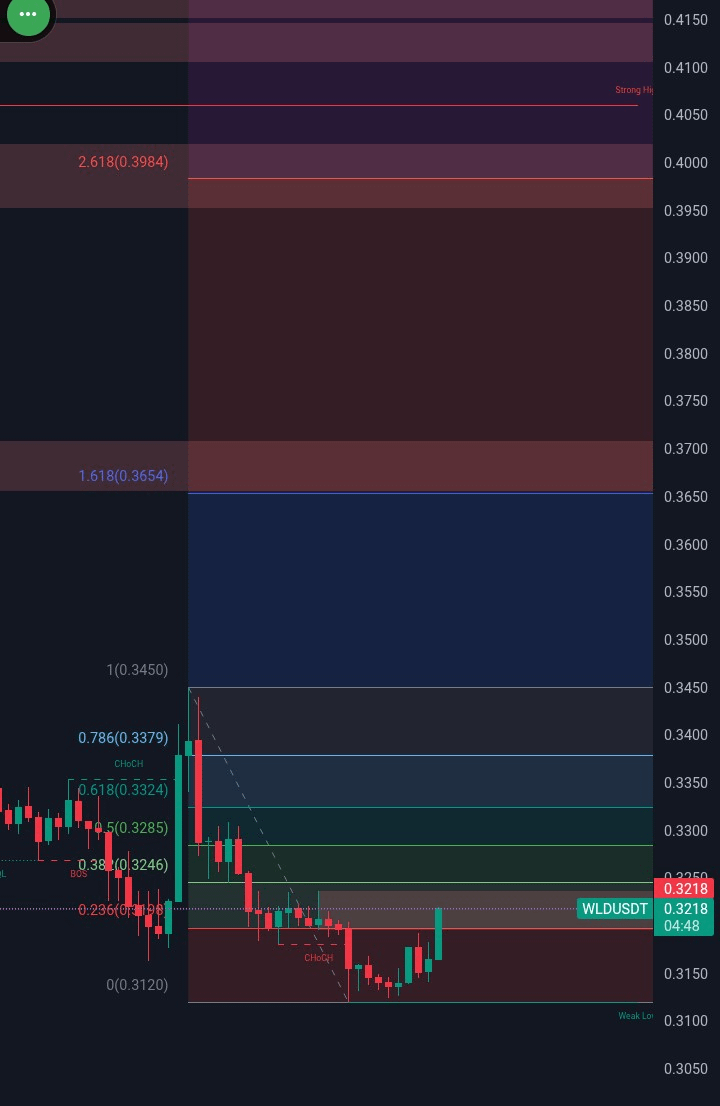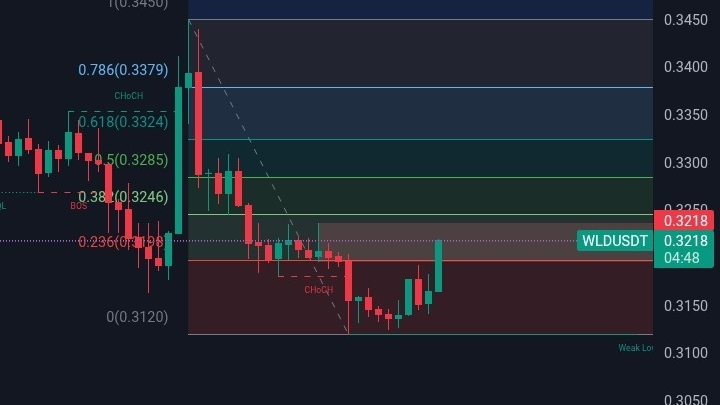
Based on the current 1-hour chart data for WLD/USDT as of late March 21, 2026, the indicators suggest the price is in a delicate "make or break" consolidation zone.Indicator Analysis (1H Timeframe)
RSI (Relative Strength Index): The RSI is currently hovering around 34–38. While this is technically "Neutral," it is leaning heavily toward the oversold boundary (30). It shows significant selling pressure but hasn't reached the point of exhaustion where a massive bounce is guaranteed. A move back toward 50 is needed to confirm a recovery.
MACD (Moving Average Convergence Divergence): The MACD histogram is slightly negative, showing weak downward momentum. There is a "converging pattern" forming, which often precedes a volatility spike. Traders are watching for a bullish crossover (the blue line crossing above the orange signal line) as a sign to enter.
Market Sentiment & Context
The broader sentiment is currently labeled as "Extreme Fear" (Index: 11), with WLD recently hitting an all-time low of approximately $0.313.
The "Bull" Case: If the RSI bounces from this 34 level and the MACD flips positive, the first major hurdle is the $0.3480 resistance (which aligns with your Fibonacci 1.0 level).
The "Bear" Case: If Bitcoin fails to hold its current levels (around $70k), WLD is predicted to potentially slide toward a support test of $0.3077 or even lower.