If you’ve spent enough time in this market, this phase feels almost predictable. The structure hasn’t really changed. Bitcoin still moves in broad four-year cycles, with halvings sitting right at the center.
Every halving cuts the block reward. That part is mechanical. But what follows? That’s driven by human behavior.
Looking at on-chain data from Arkham and beyond, the rhythm keeps repeating itself: After a crash, accumulation begins.
Then comes a steady climb into the halving.
Post-halving, momentum accelerates.
And eventually… the unwind.
Not instantly.
But inevitably.
Yes, halvings reduce supply. But what truly moves the market is how people react to that scarcity. Traders front-run the narrative, hype builds, and price stretches beyond fundamentals. And then, as always, reality pulls it back.
So far, that pattern hasn’t broken—even with institutions and macro forces starting to blur the edges.
The latest halving took place in April 2024. Before that, May 2020. And if you study what followed both events, the sequence is almost identical: A strong rally into and after the halving…
Followed by a peak…
Then a slow rollover roughly a year later.
This cycle is no exception.
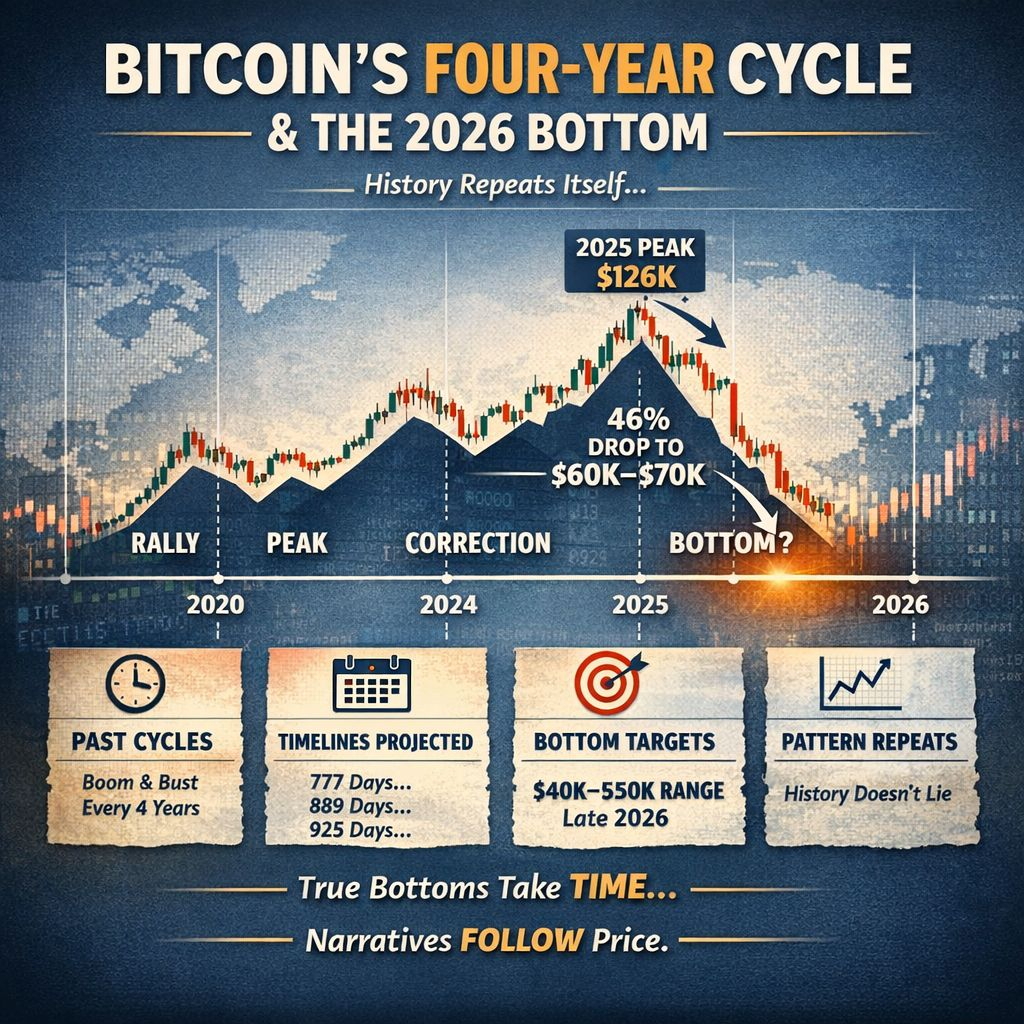
Bitcoin surged past $126K in October 2025, marking the top. Since then, it has dropped over 46%, returning to the $60K–$70K range. That’s not just volatility—that’s a classic mid-cycle correction.
And the timing?
That’s where things get interesting.
Most analysts aren’t calling a bottom yet. Instead, they’re pointing further out—toward Q4 2026.
Some projections suggest a $40K–$50K range between mid-September and late November 2026. Historically, if you look back at 2018 and 2022, cycle lows appeared roughly 12 months after the peak. Not exact—but close enough to matter.
And it’s not just one perspective.
Multiple approaches—on-chain data, cycle analysis, and market structure—all seem to align.
Some base cases sit around $45K, with room for deeper downside if macro conditions tighten. In extreme scenarios, even lower levels aren’t impossible. Not as predictions—but as reminders of how far markets can stretch when liquidity disappears.
Then there’s the cycle math.
Instead of guessing, some analysts mapped previous halvings and projected forward: 777 days
889 days
925 days
From April 2024, those timelines point to potential bottom zones around: June 2026
September 2026
October 2026
Not a single date—but a window.
And that’s how markets usually behave.
Bitcoin has historically risen for three years, followed by a sharp correction in the fourth. If that rhythm holds, then 2026 is likely the “cooling-off” year.
No surprise there.
The drop from $126K to the low $60Ks already mirrors the scale of past corrections. And historically, true bottoms don’t form overnight. They take time—often six to twelve months of sideways pain and fading interest.
Put everything together, and the picture becomes clear: Different methods. Same conclusion.
We’re not at the end of the cycle reset yet—we’re inside it.
The October 2025 top fits the pattern.
The 46% drawdown fits the pattern.
And a potential bottom in the second half of 2026? That fits too.
The key takeaway isn’t complicated.
History isn’t perfect—but it’s the best framework we have. And so far, the four-year cycle remains intact.
Markets don’t bottom when everyone starts asking if it’s time.
They bottom when people stop caring altogether.
Narratives don’t lead price. They follow it.
And by the time the story changes… the move has already begun.
