The USDC/USDT pair continues to trade within a highly compressed range, reflecting the nature of stablecoin dynamics where volatility is minimal but liquidity shifts and micro-structure moves create trading opportunities.
Current Market Overview
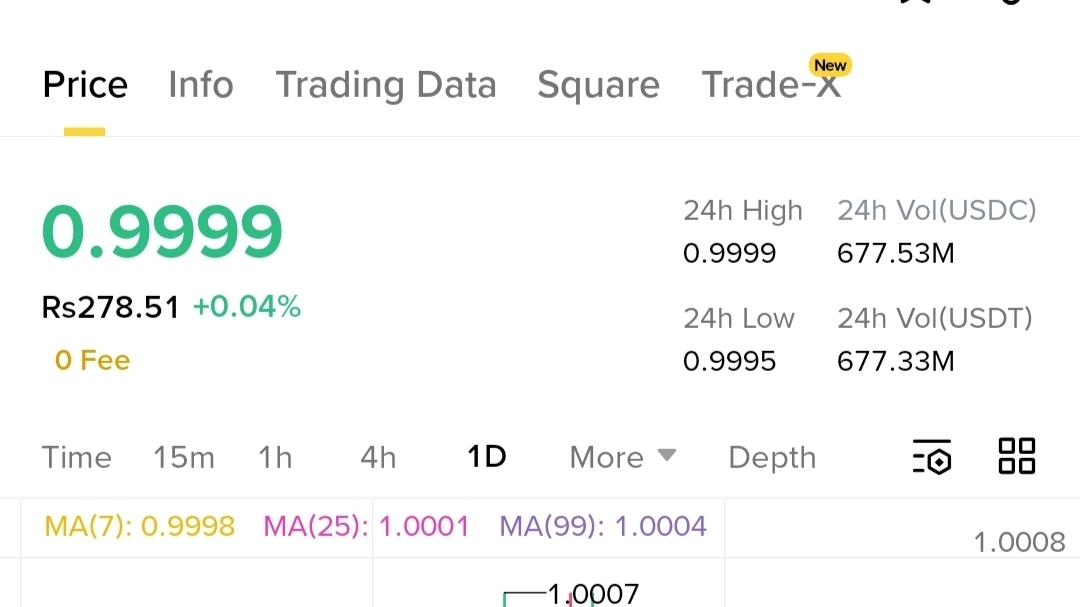
Price: 0.9999
24H High: 0.9999
24H Low: 0.9995
Volume: ~677M (USDC & USDT)
The pair is holding close to parity, which is expected for stablecoins, but the small deviations reveal underlying order flow and liquidity imbalances.
Technical Structure Breakdown
1. Moving Averages (MA) Insight
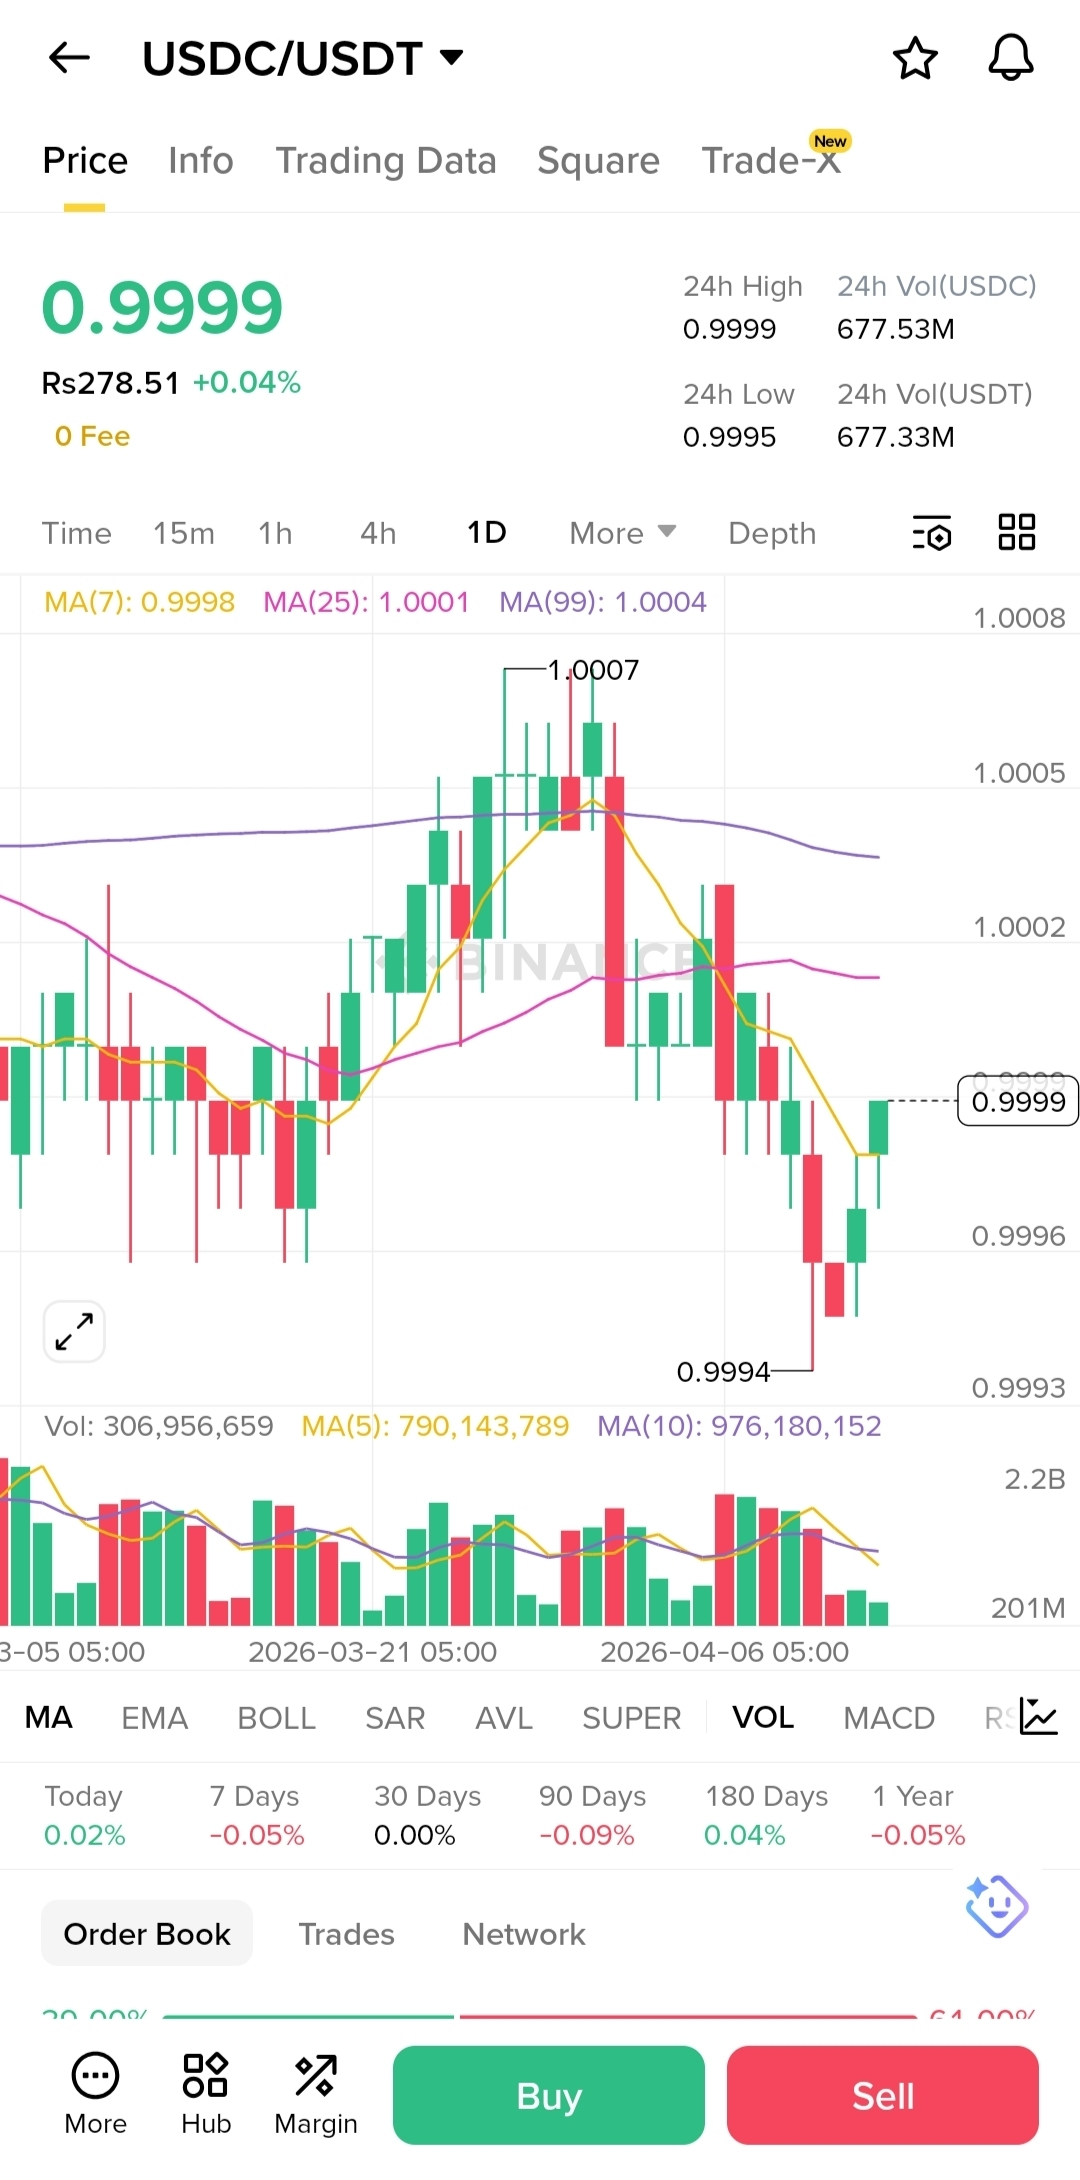
MA(7): 0.9998
MA(25): 1.0001
MA(99): 1.0004
Short-term MA is currently below mid & long-term averages, indicating:
Minor bearish pressure in the short term
Gradual reversion toward equilibrium (1.0000)
👉 This is typical behavior when temporary imbalance occurs between USDC and USDT demand.
2. Price Action Analysis
Rejection seen near 1.0007 (local resistance)
Strong downside wick around 0.9994 (support zone)
Current price bouncing from lower support
This creates a micro range:
Resistance: 1.0003 – 1.0007
Support: 0.9994 – 0.9996
📊 The chart shows a mean reversion structure, not a trend market.
3. Volume Behavior
Volume remains consistent with occasional spikes
No extreme accumulation or distribution
Indicates market makers controlling spread efficiently
👉 Stablecoin pairs are heavily influenced by:
Arbitrage bots
Exchange liquidity
Conversion demand
Market Interpretation
Unlike volatile crypto pairs, this chart reflects:
Liquidity balancing between two stable assets
Short-term inefficiencies rather than trends
Algorithmic trading dominance
The recent dip and bounce suggest:
➡️ Temporary USDC selling pressure
➡️ Followed by quick arbitrage correction
Trading Strategy Outlook
Scalping Opportunities
Buy near: 0.9994 – 0.9996
Sell near: 1.0002 – 1.0005
Key Notes
Extremely low risk but also low reward
Requires high capital or leverage for meaningful gains
Best suited for:
Arbitrage traders
High-frequency strategies
Conclusion
The USDC/USDT chart highlights a classic stablecoin equilibrium cycle, where price oscillates tightly around the $1 peg. While traditional trend trading is ineffective here, the pair offers precision-based micro trading opportunities driven by liquidity and arbitrage flows.
This is not a trend market — it’s a liquidity battlefield controlled by algorithms, where every small deviation gets quickly corrected

#USDC #USDT #Stablecoins #CryptoTrading #Liquidity #Arbitrage #Scalping #CryptoMarkets #TradingStrategy #Binance