

With Bitcoin's price reaching $70,800, the number of affected addresses has reached approximately 13.5 million.
This indicates that a significant percentage of network users bought coins at a price higher than the current spot price.
Chart Analysis:
The Inverse Relationship.
The chart from Glassnode clearly shows an inverse relationship between Bitcoin's price (black line) and the number of addresses in the red (orange line).
PeakPrice:
We note that when Bitcoin reached record highs (above $120,000 in late 2015), the number of addresses in the red was close to zero. This means that almost everyone was profiting.
CurrentSituation:
With the price dropping to $70,800, the number of "losing" addresses has jumped to 13.5 million.
What does "13.5 million addresses in the red" mean?
These are people who bought at or near the peak and are now watching their wallets shrink. In trading, this situation is called "Overhead Supply."
The expected short-term impact is:
1️⃣ Selling resistance at breakeven:
When the price starts to rise again, many of these 13.5 million traders tend to sell as soon as the price reaches the "breakeven point" (i.e., the price at which they bought) to exit the market without a loss.
This creates selling pressure that prevents the price from rising quickly.
2️⃣ Capitulation risk:
If the price continues to fall or plateau for an extended period, these traders may lose hope and sell at a loss, potentially leading to a local market "bottom."
Follow along to discover how we can relate the results of the Losing Addresses Index to the liquidation heat map, and what Bitcoin's expected movement might be.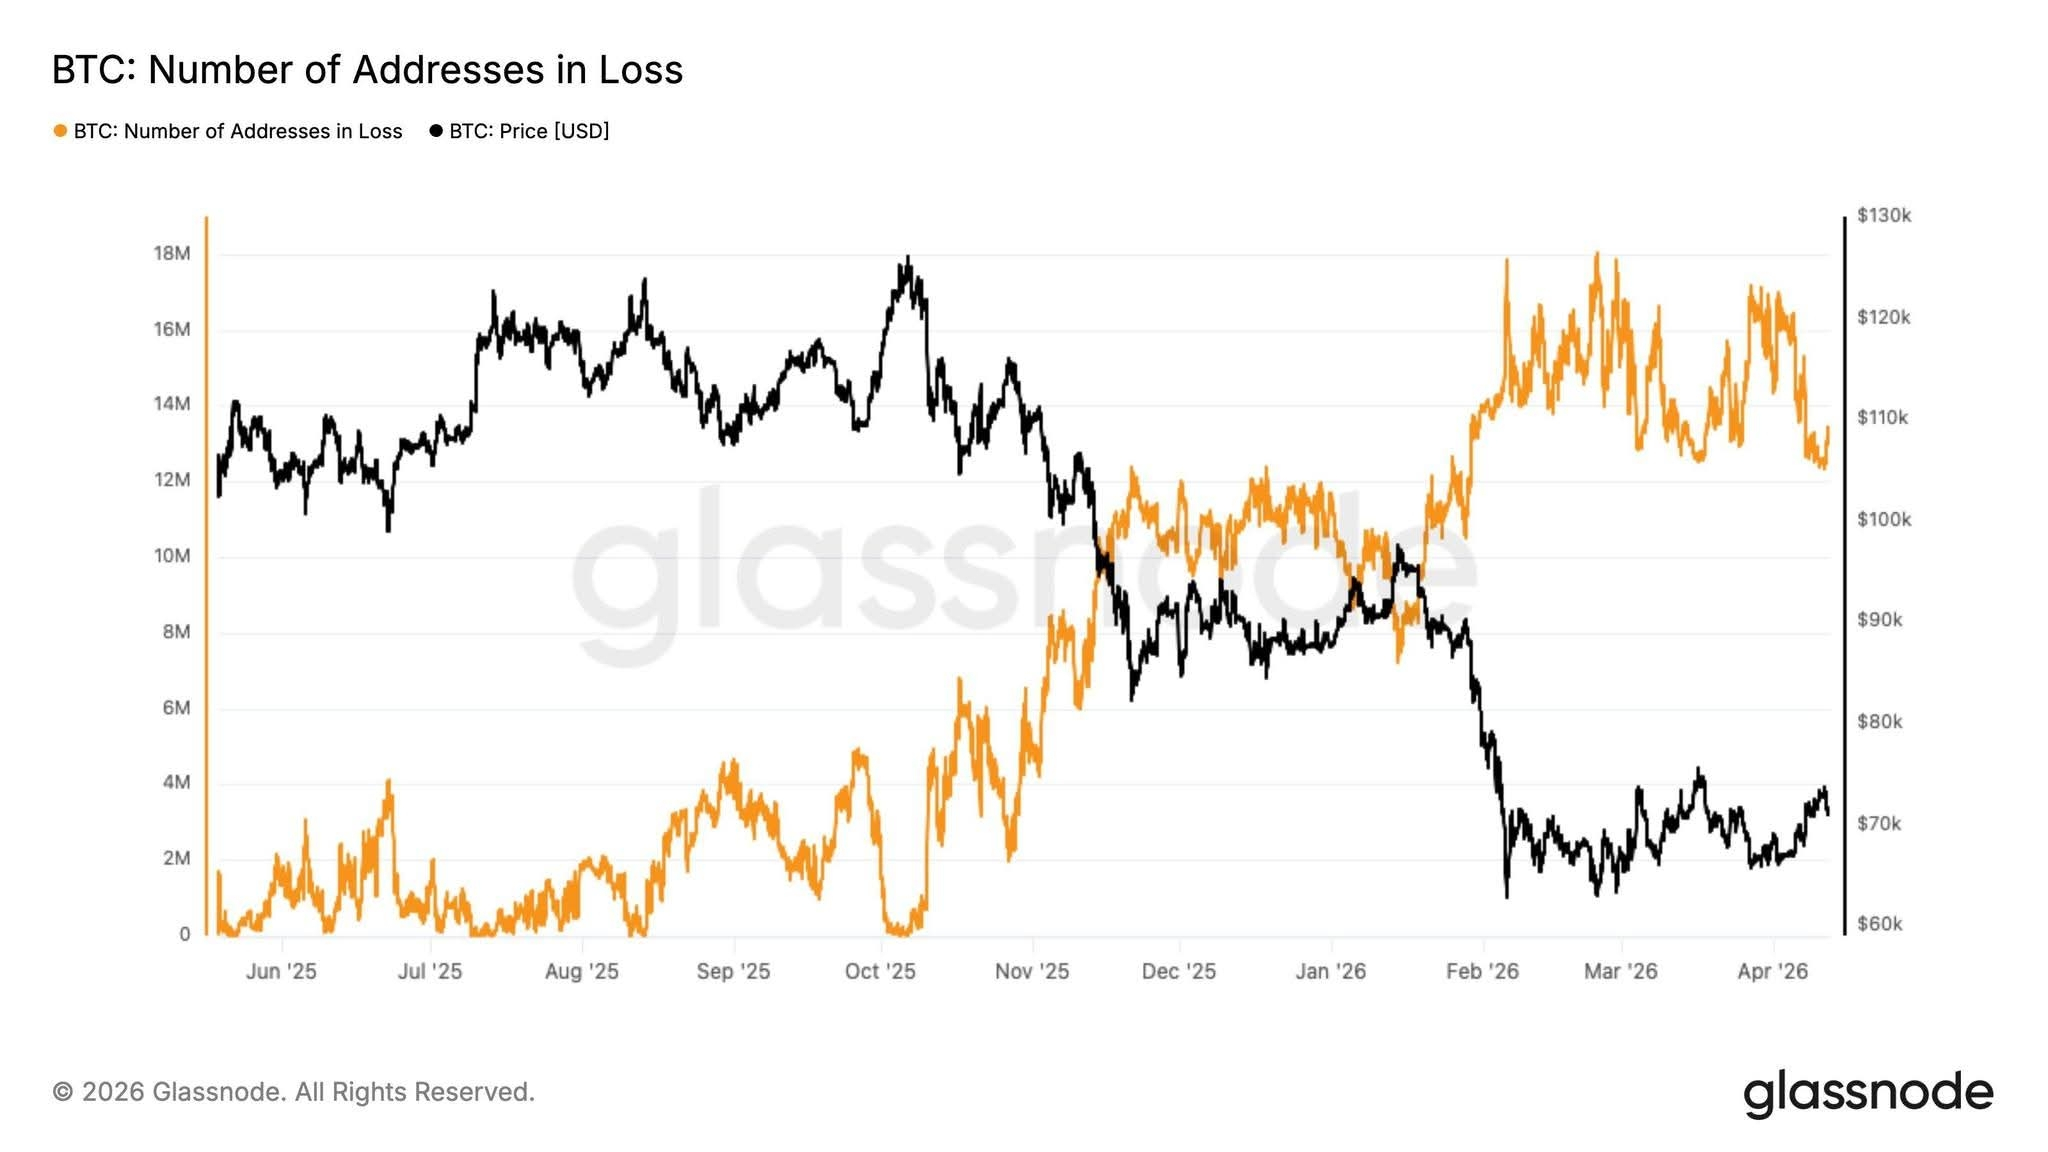
Bitcoin:
The recent pullback confirms that the latest push was driven by futures.
Bitcoin's price dropped from $73,788 to $70,776, a decline of approximately 4%.
More importantly, this price movement was primarily driven by a significant increase in open volume over the past eight days, indicating a substantial expansion in futures positions.
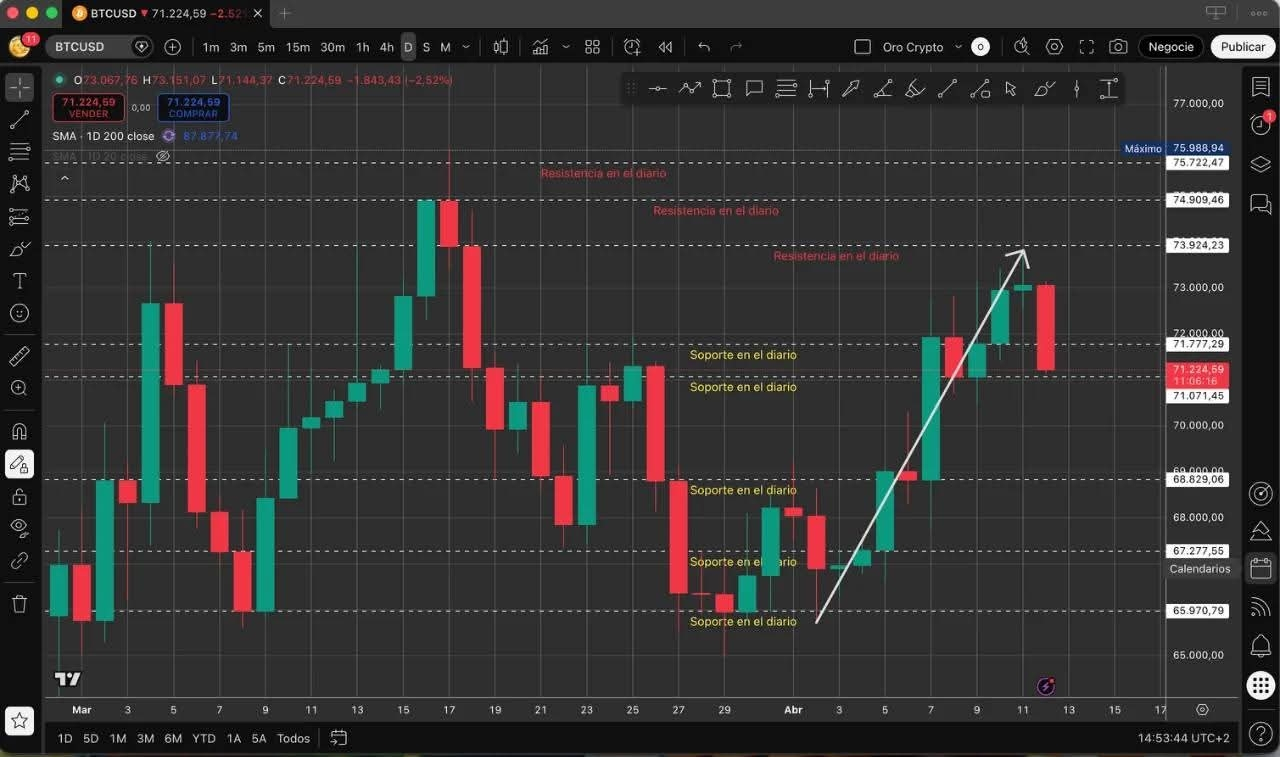
The price chart on the TradingView platform clearly shows almost the same open volume structure over recent days.
This is not coincidental; open volume is largely composed of futures positions, so its growth typically reflects increased leverage rather than strong spot market demand.
As the price momentum began to slow, open volume also started to lose momentum.
Both structures ceased expanding with the same intensity. Today's drop not only indicates a correction but also a break of the uptrend, and this break is reflected in the open volume.
The contraction in open volume coincides with the loss of the price structure.
This reinforces the hypothesis that much of the growth seen over the past eight days was driven by the opening of futures positions, rather than a sustained influx of spot demand. In other words, the previous rally was supported by a fragile, leveraged structure.
The break of the uptrend with a dominant bearish Bitcoin candle, which invalidates the last major candle of the previous bullish structure, technically confirms a true break of this trend.
In this context, the market is now experiencing a bearish or corrective phase, with the potential for a pullback towards the initial impulse zone.
Without strong spot demand, any rebound will remain structurally fragile.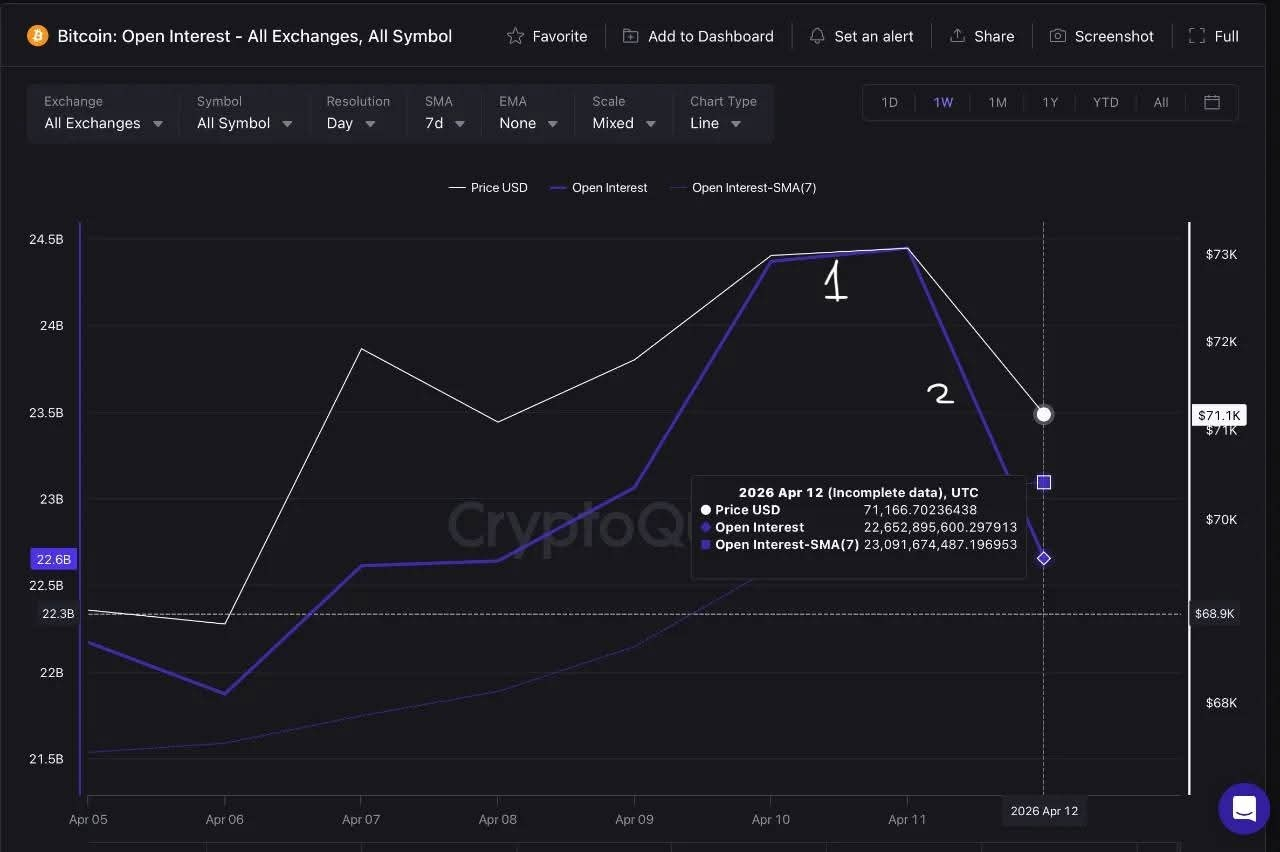
Bitcoin Market Analysis:
Between Liquidity "Trap" and "Overhead Supply" Pressure.
We are currently at a critical juncture in Bitcoin's ($BTC) price movement, requiring close monitoring of price behavior at critical liquidity levels.
Here's a summary of the technical and quantitative outlook:
1. On-Chain Data:
With the price stabilizing around $70,730, data indicates that 13.5 million addresses are currently in a losing position.
These represent what's known as "overhead supply": potential selling pressure as the price attempts to return to their break-even point, which could slow the immediate upward momentum.
2. Liquidity Heatmap:
The heatmap shows a high concentration of liquidity in two opposing zones:
1️⃣ Near Target (Magnet): $70,356 level (liquidating approximately $80 million of buy positions).
2️⃣ Longer Target (Fuel): $73,935 level (liquidating approximately $85 million of sell positions).
3️⃣. Technical Analysis (Technical Outlook): The price is currently trading above a key support level at $70,506 and near the 7-day SMMA. Expected Scenario:
We anticipate a "liquidity grab" with a rapid drop to the $70,356 level to clear the market and provide liquidity for the whales.
If the price manages to bounce back quickly and close above the moving average, this will be a strong signal to move towards the next resistance at $71,954, potentially reaching the breakout zone at $74,000. 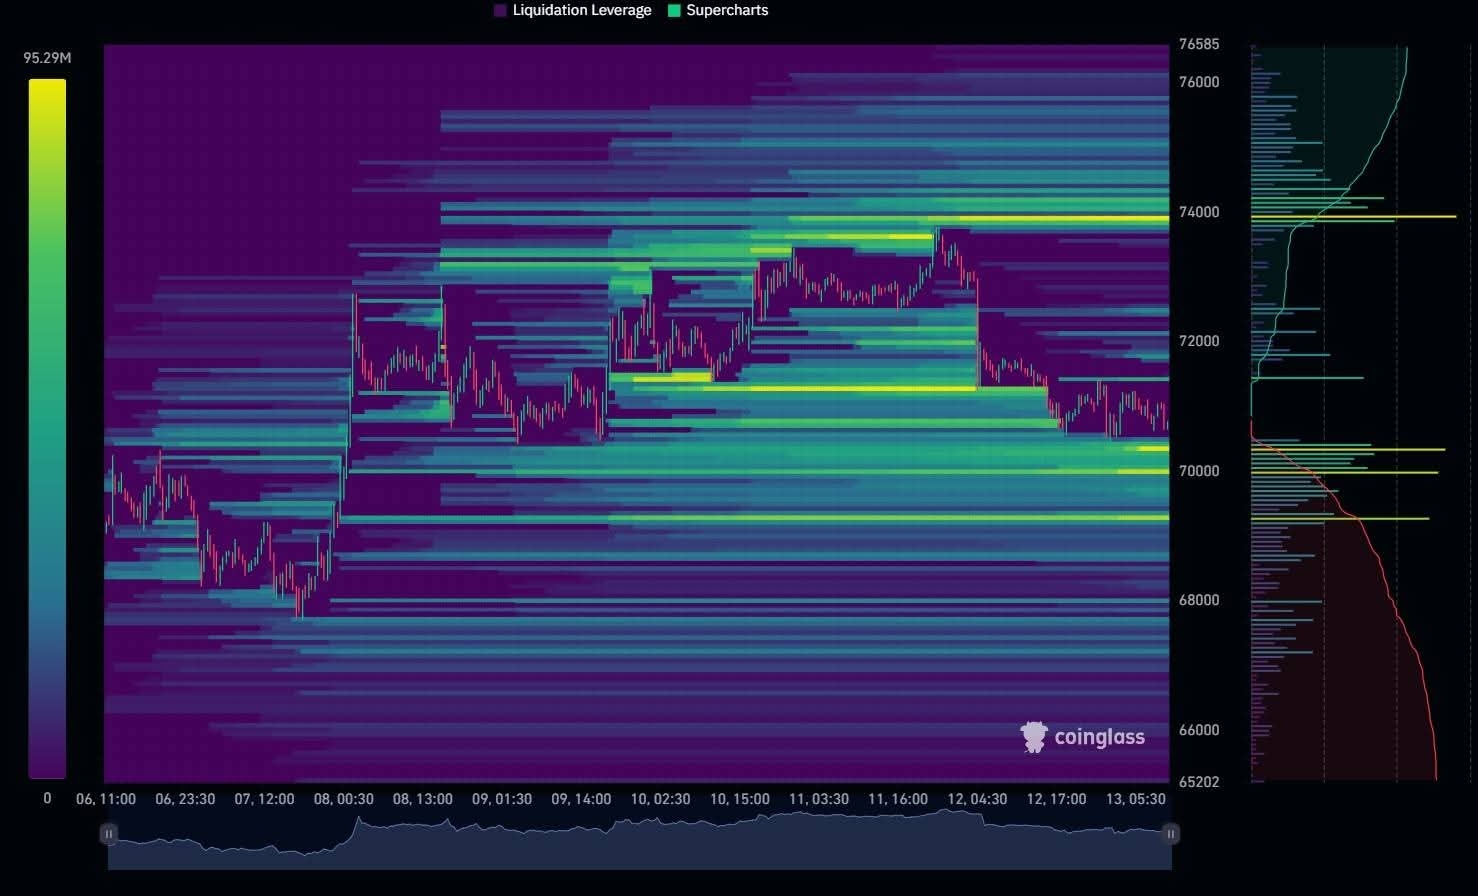
Conclusion:
The market is looking for "fuel" to rise, and this fuel often comes from the liquidation of impulsive traders before a major move.
Keep an eye on trading volume at support levels.