The macro backdrop looks bullish—at least on the surface.
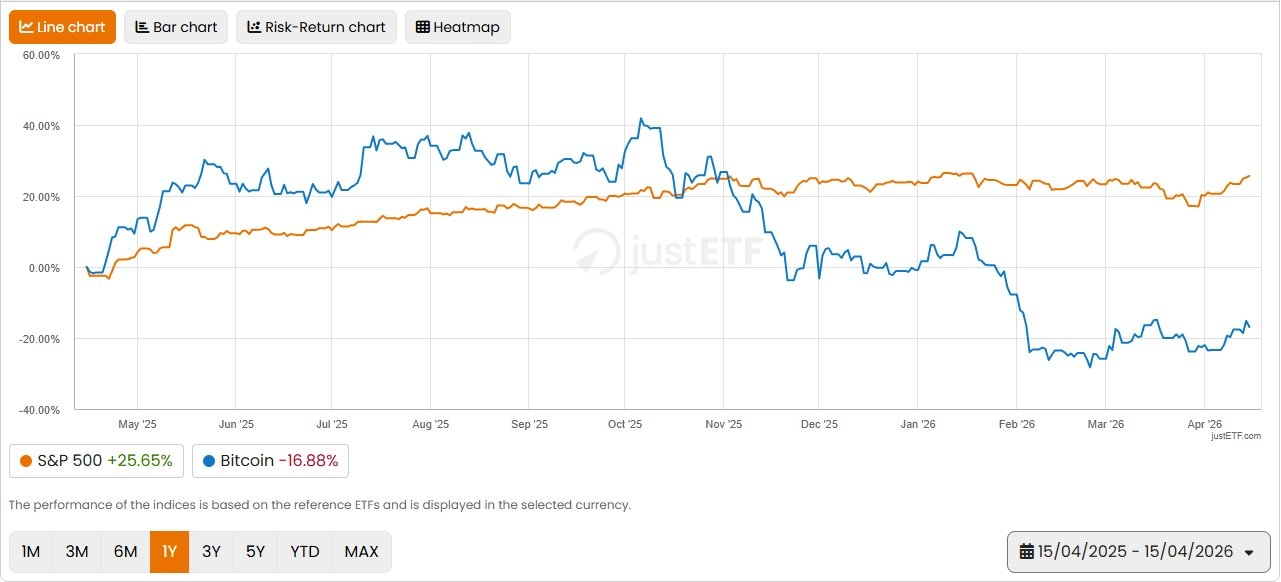
The S&P 500 just printed a new all-time high.
The Nasdaq Composite has completed its strongest 11-day run in history.
Yet at the same time, Bitcoin is sitting ~42% below its peak.
That divergence isn’t random. Something structurally broke.
---
1. The Old Relationship: Bitcoin = High Beta Tech Trade
For most of 2025, Bitcoin behaved like a leveraged version of equities.
Stocks up → BTC up more
Stocks down → BTC down harder
It was essentially a high-beta proxy for risk-on sentiment, closely tied to liquidity and tech momentum.
---
2. The Breaking Point: October 10–11, 2025
Then came the event that changed everything.
~$19 billion in liquidations in 48 hours
~70,000 BTC in open interest wiped out
Total OI collapsed from $45B → $21.9B
This wasn’t just a correction—it was a full deleveraging shock.
The leverage engine that had been driving BTC rallies for nearly two years got dismantled…
and more importantly, it never came back.
---
3. The Key Shift: Correlation Collapse
Before the crash:
BTC and equities were positively correlated
After the crash:
The 30-day correlation flipped negative
This is critical.
Bitcoin is no longer reacting to the same drivers as stocks.
They are now operating in separate liquidity regimes.
---
4. Why Stocks Are Pumping (But BTC Isn’t)
Equities are being driven by very specific catalysts:
Geopolitical optimism (e.g., Iran peace developments)
Strong AI earnings narrative
Massive concentration in mega-cap tech
Example:
Nvidia just printed 11 consecutive green days
The “Mag 7” dominance is extreme:
Mag 7 ETF: +18% since March 30
Rest of S&P 500: only +8%
This is a narrow, liquidity-driven rally, not a broad risk-on environment.
Bitcoin isn’t benefiting because:
It no longer has leveraged fuel
It’s not being pulled by the same narratives
---
5. Where We Are in the Bitcoin Cycle
Let’s zoom out.
Last halving: April 2024
Next halving: March 2028
Current phase: mid-cycle
Historically, this phase is brutal:
Typical Cycle Pattern:
12–18 months post-halving: cycle top
24–30 months post-halving: deep drawdown bottom
30–36 months: recovery into next cycle
Right now, we’re in the mid-cycle compression zone—
where:
liquidity dries up
narratives fade
weak hands get wiped
---
6. Will Bitcoin Pump Again?
Yes—but not for the reasons most people expect.
Not because:
stocks are going up
AI is booming
macro looks bullish
Instead, BTC moves when:
its own liquidity cycle resets
leverage rebuilds
supply dynamics tighten post-halving
---
7. The Real Takeaway
This cycle taught a very important lesson:
Bitcoin is no longer just a “digital Nasdaq.”
It’s evolving into a distinct macro asset with:
its own cycle
its own liquidity drivers
its own structural behavior
---
Final Thought
If you were trading BTC as a simple beta play → this is bad news
If you understand Bitcoin’s independent cycle → this is an opportunity
Because once the internal engine restarts,
BTC doesn’t follow markets…
It leads them.
If you're tired of fake pumps and want real market structure insights...
Follow for:
Clear BTC cycle breakdowns
Smart money perspective
No hype, only logic
Hit follow and stay ahead of the market. 🚀

#BitcoinPriceTrends #CZ’sBinanceSquareAMA #CryptoMarketRebounds #USDCFreezeDebate #USDCFreezeDebate