The recent price action on $SIGN SIGNUSDT has caught everyone’s attention. After a sharp flush-out from the $0.02900 level, the market is currently in a "wait-and-see" phase. Let’s dive into the 15-minute chart to see where the next big move is heading.

$SIGN 15 Min Chart
The Technical Breakdown
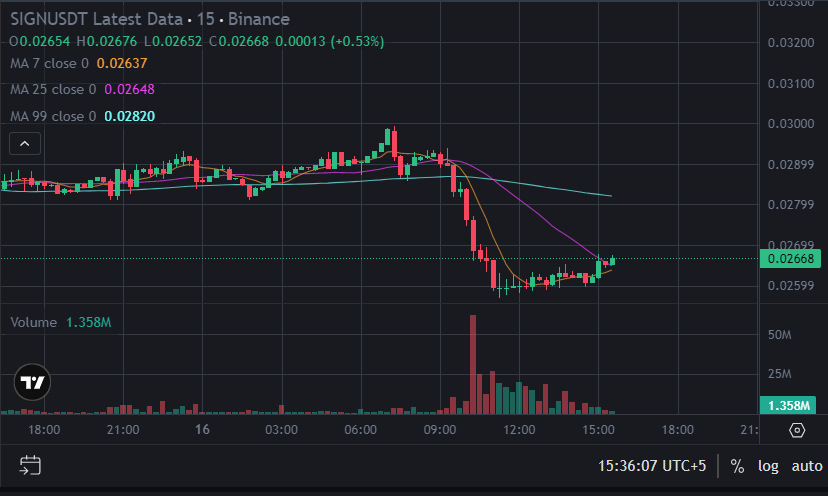
Looking at the 15m timeframe, we can see a clear Capitulation Phase. The massive red candles wiped out over-leveraged longs, leading us to a local bottom near $0.02550.
Current State: Price is consolidating in a tight range between $0.02600 and $0.02650.
Volume Profile (CDV): The Cumulative Delta Volume shows that the aggressive selling pressure has finally plateaued. This often precedes a "Dead Cat Bounce" or a genuine trend reversal.
The Trend: While the macro trend remains bearish, we are seeing a bullish divergence-like stability at these lows.
The Game Plan (Spot Strategy)
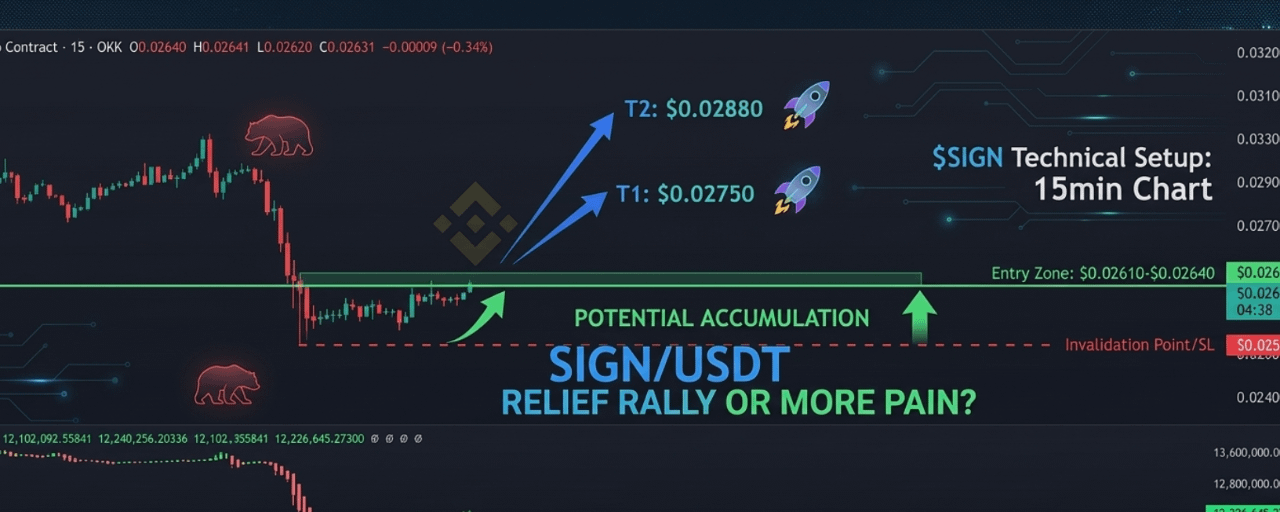
For those looking to capitalize on this volatility, here are the key levels to watch:
Entry Zone: $0.02610 – $0.02640 (Accumulating in this zone offers a good risk-to-reward ratio).
Resistance to Clear: $0.02700. A 15m candle close above this level is our signal for a trend shift.
Target 1 (Conservative): $0.02750
Target 2 (Mid-term): $0.02880 (Filling the liquidity gap)
Target 3 (Moon Shot): $0.03050
Risk Management 🛡️
In highly volatile assets like SIGN, protection is everything.
Invalidation Point: If we lose the $0.02520 support, the bullish thesis is dead. Keep your Stop Loss tight.
What do you think? Is $SIGN preparing for a 15% bounce, or are we heading lower? Let me know your thoughts in the comments! 👇