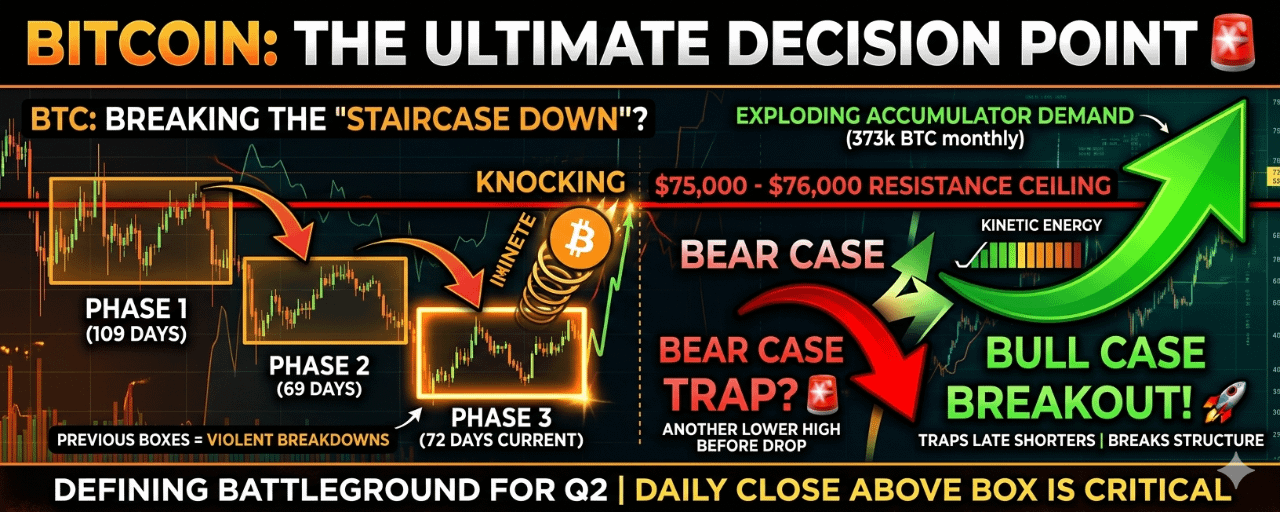
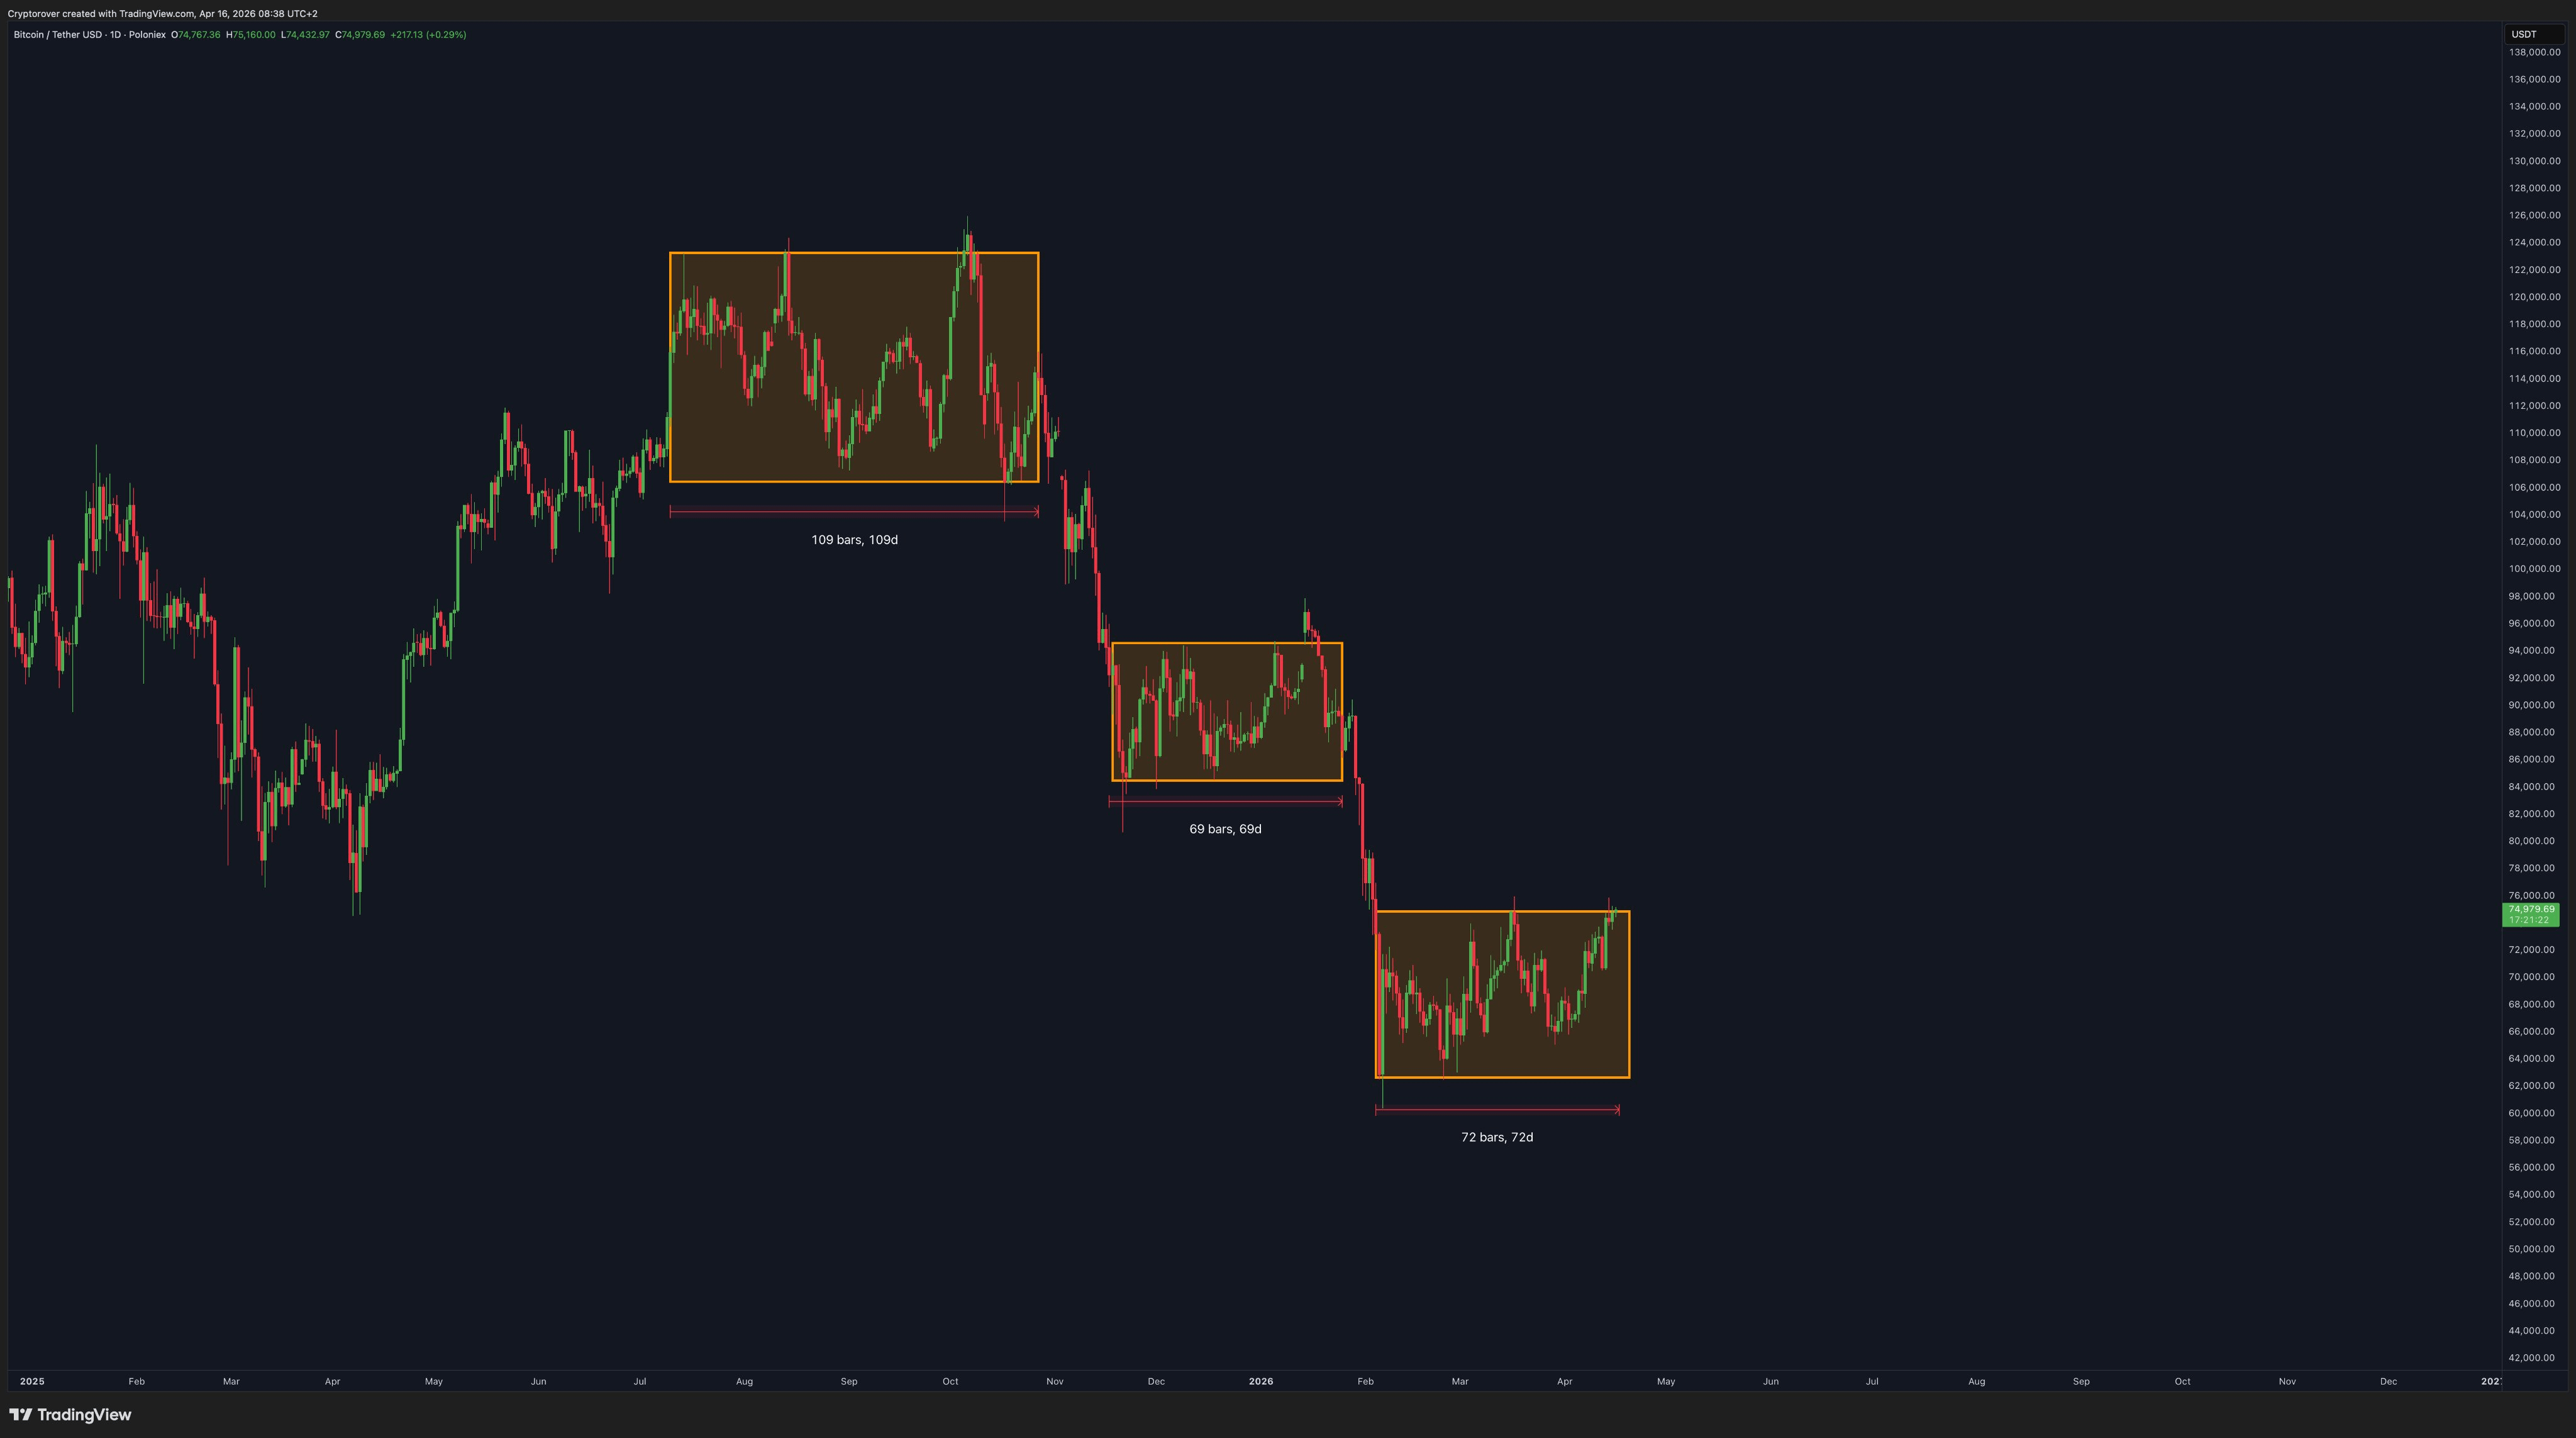
The chart reveals a textbook "Staircase Down" market structure. We have been trapped in three distinct consolidation zones, and the clock is ticking:
📦 Phase 1 (109 Days): High-range Distribution.
📦 Phase 2 (69 Days): Mid-range Markdown.
📦 Phase 3 (72 Days): Our Current Battleground.
The Setup:
$BTC is currently testing the $75,000 – $76,000 resistance—the absolute ceiling of this third consolidation box. Having spent 72 days in this "chop" zone, the kinetic energy is coiled for a massive expansion.

The Bull vs. Bear Standoff:
🐻 The Bear Case: Market structure remains bearish. The previous two boxes ended in violent breakdowns. Technical traders are looking for a "Lower High" rejection here to confirm a move toward $60k.
🚀 The Bull Case: On-chain data is screaming Accumulation (373k BTC/month) and Macro Liquidity is rising via Treasury buybacks. The fundamental floor has never been stronger.
The Verdict:
A decisive daily close above this box doesn't just mean "price go up"—it invalidates months of bearish market structure and triggers a massive short squeeze.
Are we finally breaking the staircase, or is this the ultimate trap? Drop your targets below! 👇🔥
#BTC走势分析 #bitcoin #priceaction #MarketStructure #tradingStrategy

