You stare at the chart. Candles. Patterns. Trends.
But the chart only shows you the past.
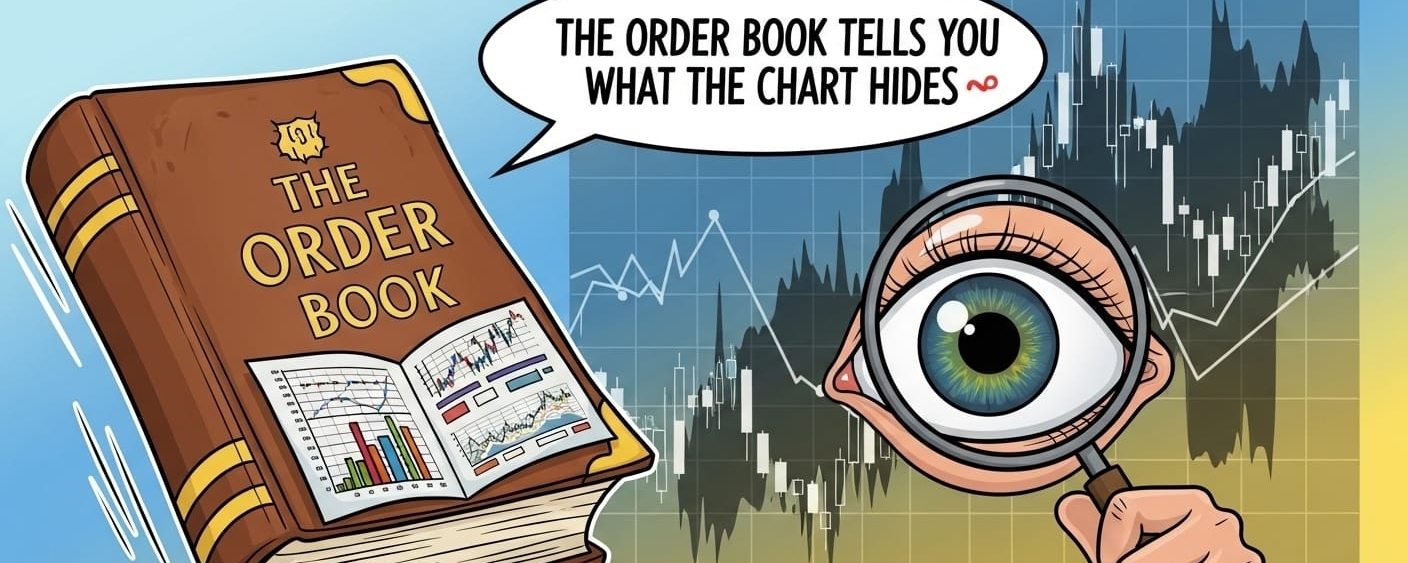
The order book shows you the present. The real-time battle.
Let me explain what most traders miss.
📍 WHAT IS THE ORDER BOOK?
It's a live list of all buy and sell orders waiting to be filled.
Buy orders = bids (support).
Sell orders = asks (resistance).
The chart is just a story of what already happened.
The order book is the battlefield happening right now.
📍 WHAT THE ORDER BOOK REVEALS
✅ Large buy walls
A massive buy order at a certain price means whales are defending that level.
Price likely won't go below it.
✅ Large sell walls
A massive sell order means strong resistance. Price will struggle to break it.
✅ Walls disappearing
When a large wall suddenly vanishes, someone is manipulating.
Either they moved their order, or they're about to make a move.
✅ Spoofing
Fake orders placed to trick traders, then cancelled.
Whales use this to create false signals.
📍 HOW TO USE ORDER BOOK DATA
Before entering a trade:
1. Check the bid side. Is there strong support?
2. Check the ask side. Is there heavy resistance?
3. Look for walls. Are they real or disappearing?
4. Watch for spoofing. Sudden order cancellations.
If you see a large buy wall and thin sells above – price likely goes up.
If you see a large sell wall and thin buys below – price likely goes down.
📍 REAL EXAMPLE
Chart shows Bitcoin at $50k resistance.
Order book shows a massive sell wall at $50,200.
You know price will struggle to break it.
You don't buy. You wait.
Then the wall disappears. Someone removed it.
That's a signal. Smart money is about to push through.
You enter. Price rips to $51k.
The chart didn't tell you any of this. The order book did.
📍 MY RULE
I never enter a trade without checking the order book first.
The chart is the newspaper. The order book is the live news feed.
Read both. Or get left behind.
Do you check the order book or just the chart?