
I will be Honest... Risk Warning: The following is an objective technical market analysis and does not constitute any trading/investment advice. Cryptocurrency is highly volatile; strictly control position sizes and stop-losses.
1. Real-Time Price and Market Overview
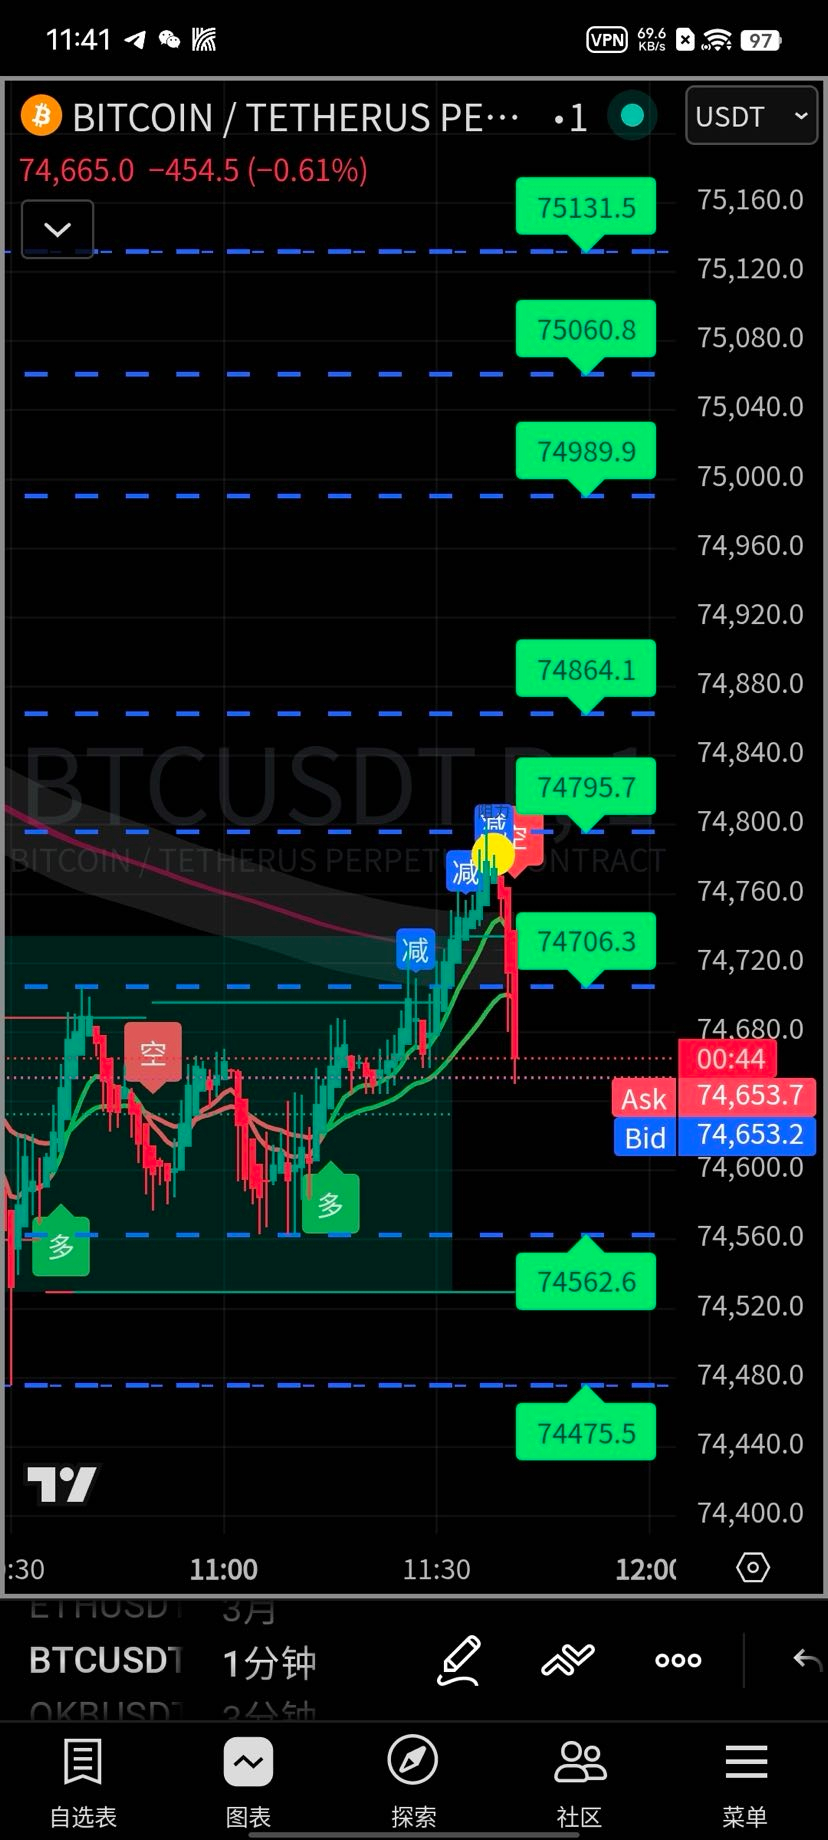
Current BTC spot price: $74,986, closely aligned with the key psychological and options core level of $75,000, oscillating around this zone
24-hour slight sideways fluctuation, no macro strong drivers, locked within high Gamma options range, mainly narrow-range pinning during the day
2. Key Support/Resistance Levels (Options + Structural Resonance Levels)
Resistance levels (from top to bottom)
• $76,000: Second Gamma strong pressure, recent high point dense selling zone
• $75,000: Daily maximum magnet level, first Gamma resistance, current price near this line
Support levels (from near to far)
• $74,000: Daily risk dividing line, a valid breakdown would amplify short-term volatility
• $73,500: 4-hour strong support, lower boundary of ascending triangle
• $72,000: Mid-term defense level; $71,000: Long-term trend support line
3. Multi-Timeframe K-Line Structures
Daily
Long upper shadow + decreased volume, confirming heavy selling pressure above $76,000; price remains above short-term moving averages, mid-term bottoming structure intact
4-hour
Ascending triangle consolidation, upper boundary at $76,000, lower boundary at $73,500; currently oscillating in the middle of the triangle, awaiting breakout direction
4. Indicator Data (Real-Time)
• Moving Averages: MA50(69807), EMA50(71273) golden cross, indicating a mid-term bullish bottom structure; long-term MA200(87138) still acts as a major resistance ceiling
• RSI(14) 4-hour: 55, neutral leaning bullish, no overbought signals, upward space remains but lacks explosive momentum
• Options GEX Structure: Price is pinned at the most sensitive central hub of the entire market; $75,000 is the core anchor point, breaking above or below will trigger liquidity sweeps
• Derivatives Sentiment: Funding rates are persistently negative, short positions crowded, institutions continue to accumulate at low levels to absorb selling pressure
5. Core Intraday Judgment and Trend Projection
1. Daily Tone: Narrow-range grinding, no clear trend, mainly bouncing within the $74,000–$75,000 zone
2. Bullish Trigger: Hold above $75,000 and close the day there → test resistance at $76,000
3. Bearish Trigger: Effective breakdown below $74,000 → volatility increases, retest $73,500 and $72,000
4. Breakout Targets
◦ Break above $76,000: first target $78,000, long-term outlook toward $84,000 range
◦ Break below $73,500: first target $72,000, secondary trend line at $71,000
6. Simplified Intraday Trading Ideas (Structural Reference Only)
• Long Positions: Only consider entering after holding above $75,000, with stop-loss below $74,000
• Short Positions: Only consider entering under pressure at $76,000, with stop-loss above $76,500
• Range Trading ($74,000–$75,000): No chasing, avoid heavy positions, as options pinning may cause repeated whipsaws