For years, one of the strongest beliefs in the crypto market has been the so-called “4-year cycle theory.”
It sounds simple. Clean. Predictable.
👉 Every 4 years — Bitcoin tops, then crashes.
👉 Midterm election year? Bear market.
👉 Recovery follows like clockwork.
But here’s the uncomfortable truth…
What if this entire belief is built on extremely limited data — and traders are blindly trusting a pattern that may no longer exist?
🧠 The Problem With “It Always Happens”
Let’s be honest.
When people say “it always happens”…
they are referring to just 3 previous cycles.
That’s not a law.
That’s not a guarantee.
That’s barely even a statistically reliable sample.
Markets evolve.
Liquidity changes.
Participants change.
And most importantly — macro conditions shift.
Yet many traders are still stuck in a fixed mindset:
“Price must go down because it always did before.”
That kind of thinking doesn’t just limit profits…
it creates traps.
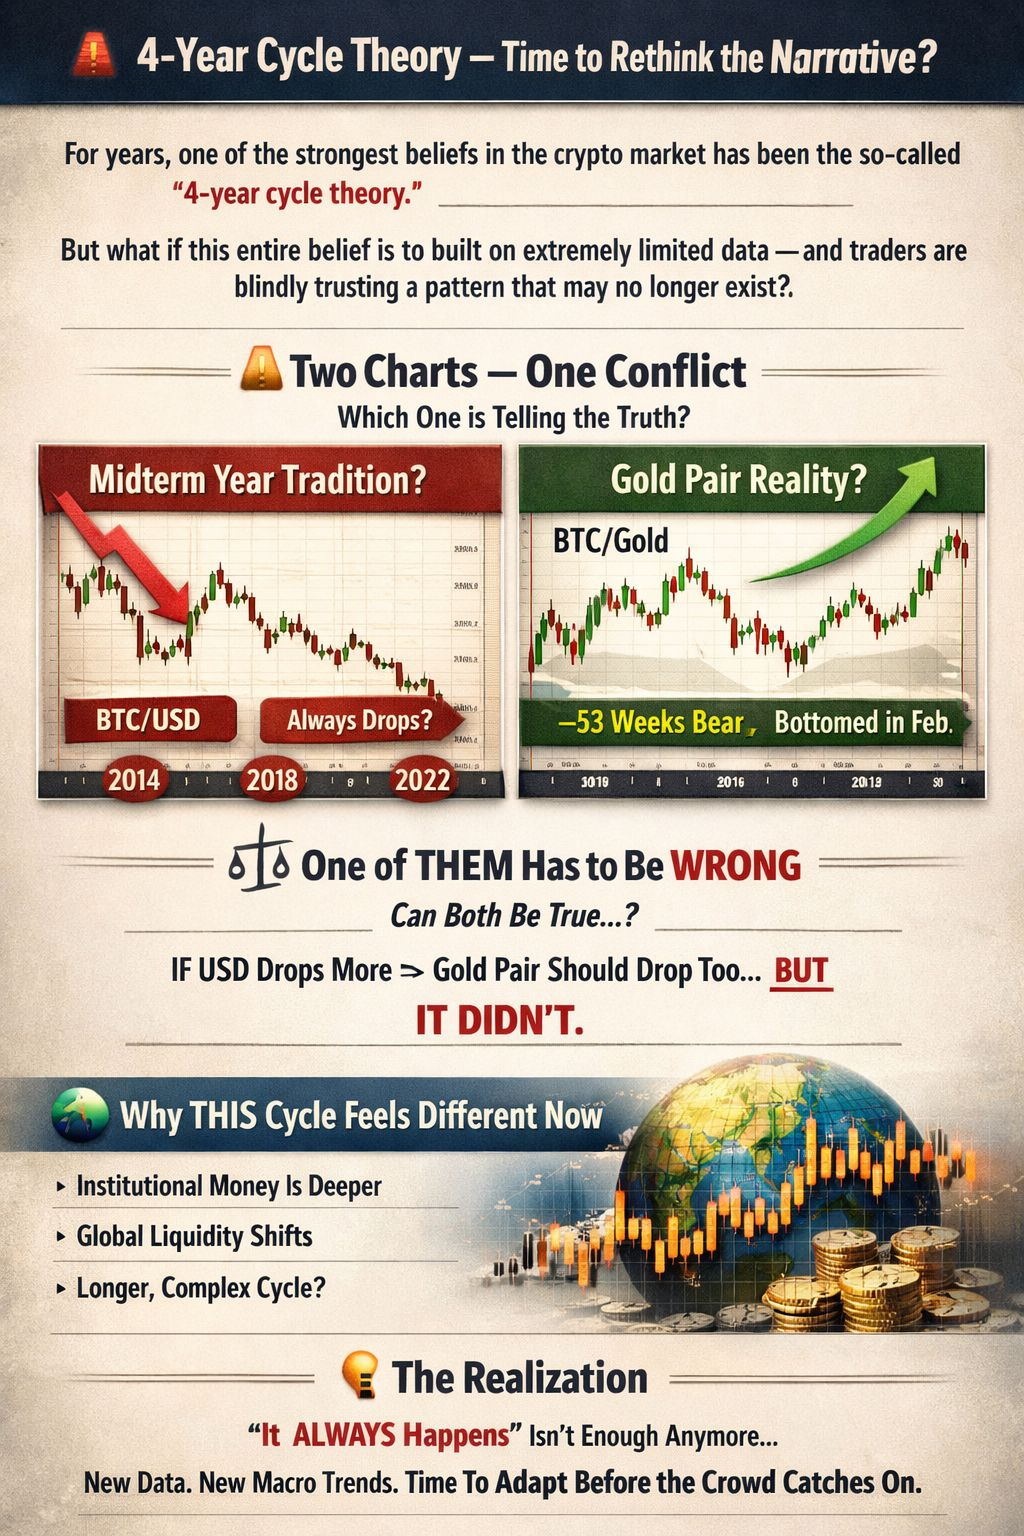
📊 Two Charts — One Conflict
Now let’s break down something more interesting.
You’re looking at two narratives:
1️⃣ The Classic View (USD Pair)
The idea here is simple:
Midterm year = bearish pressure
Price must go lower
History repeats exactly
2️⃣ The Relative Strength View (Gold Pair)
This is where things get more nuanced.
Instead of measuring value in dollars, we compare it against gold — a traditional store of value.
And here’s what stands out:
👉 The $BTC vs $XAU chart has already spent over 53 weeks in a bear phase
👉 It reached a bottom around late February
👉 That aligns closely with a broader market reset
Now think about it…
If the USD pair was supposed to go significantly lower:
➡️ Then the gold pair should also continue dropping
➡️ But it didn’t
➡️ It already formed a base
That creates a contradiction.
⚖️ One of Them Has to Be Wrong
You can’t have both:
“It always dumps in midterm years”
AND
“The bear cycle already completed against a hard asset like gold”
Because if one repeats history perfectly…
the other one must break it.
And right now?
👉 The structure suggests something different is happening.
🌍 Why This Cycle Feels Different
This isn’t just about charts.
There are bigger forces at play:
Institutional money is deeper than ever
ETFs and regulated exposure changed market structure
Global liquidity cycles are shifting
Inflation narratives are influencing capital flow
Crypto is no longer a niche market — it’s macro-sensitive
All of this points to one thing:
👉 This may not be a standard 4-year cycle anymore
👉 It could be evolving into a longer, more complex cycle
💡 Investment Perspective (The Part Most People Miss)
This is where smart investors separate themselves from emotional traders.
Instead of asking:
“Will it repeat exactly?”
Ask:
“What is the market telling me right now?”
If the bottom is already forming across key pairs…
Then:
Accumulation phases may already be underway
Fear-driven narratives could be lagging reality
Early positioning might matter more than perfect timing
And historically…
👉 The biggest gains don’t come from following the crowd
👉 They come from recognizing when the crowd is wrong
🔍 Final Thoughts
The “4-year cycle” isn’t completely useless —
but treating it like a fixed rule?
That’s dangerous.
Because markets don’t reward certainty.
They reward adaptability.
Right now, we’re seeing signs that:
Old patterns are weakening
New structures are forming
And blind belief in repetition could cost opportunities
So yes — your logic makes sense.
Not because it guarantees anything…
But because it questions something most people never challenge.
🚀 The Real Edge
It’s not about predicting the future perfectly.
It’s about understanding this:
👉 When everyone believes the same story…
👉 That’s usually where the biggest mispricing begins.
And right now?
That story might be breaking.