As of April 17, 2026, Solana (SOL) is attempting a significant trend reversal after a grueling six-month period of depreciation. While the token is still fighting long-term bearish structures, the mid-April data suggests that the "bottom" may finally be in.
Solana (SOL) Market Analysis
1. Price Performance & Trend
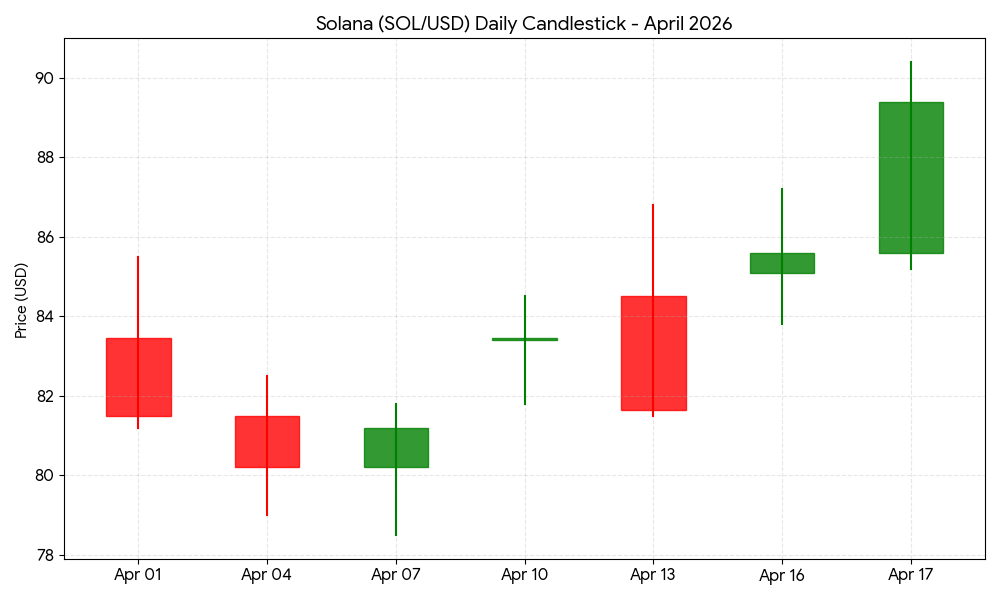
Current Price: Approximately $89.40, showing a strong recovery of over 7% in the last 24 hours.
The "Six-Month Curse":
Before this week, SOL had not recorded a single positive month since September 2025. April 2026 began with similar pressure, testing lows near $78, but institutional demand has finally triggered a bounce.
Institutional Pivot:
SOL-focused ETFs recorded $15.5 million in inflows on Thursday alone, signaling that Wall Street is beginning to re-accumulate the asset at these discounted levels.
2. Technical Outlook
Support:
The $78–$82 zone has established itself as a critical psychological and technical floor. Multiple tests of this range were met with aggressive buying volume.

Resistance:
The primary challenge is reclaiming the 100-day EMA at $98.00. A decisive break above $100 would invalidate the long-standing "Head and Shoulders" bearish pattern and likely trigger a rally toward $134.
Momentum:
The daily RSI has climbed to 55, moving out of the "neutral-bearish" zone into "improving bullish" territory. The MACD is also showing constructive green bars, indicating that selling pressure is exhausting.
3. Network & Ecosystem Resilience
Explosive Activity:
Despite the price stagnation, Solana’s network activity hit a record $1.1 trillion in Q1 2026, its first-ever trillion-dollar quarter.
Institutional Recovery:
Following a major exploit of the Drift Protocol in early April, Tether led a $150 million recovery plan, significantly restoring market confidence in the ecosystem's safety net.
Upgrades:
The upcoming "Alpenglow" consensus upgrade aims to reduce block finality to 150 milliseconds, positioning Solana for institutional-grade high-frequency trading.
SOL/USD Daily Candlestick Chart (April 2026)
The chart below illustrates the "V-shaped" recovery attempt starting from the mid-April lows.
Key Takeaway:
Solana is currently a "Fundamental Giant" that has been a "Price Laggard." The massive gap between network usage ($1.1T quarter) and token price suggests a potential period of aggressive repricing if SOL can break and hold above the $98–$100 resistance zone.