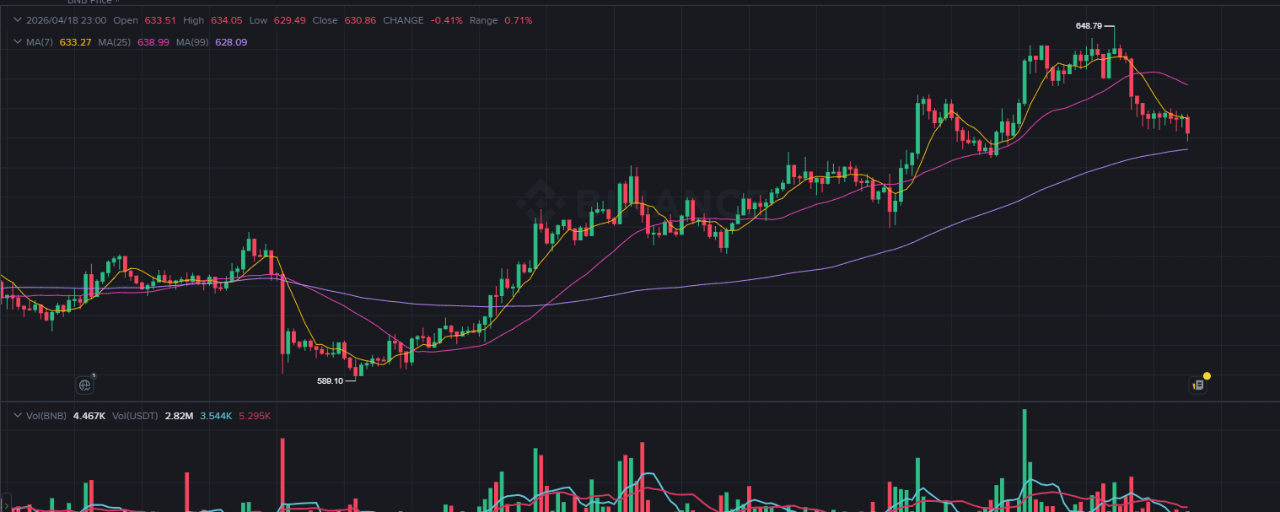

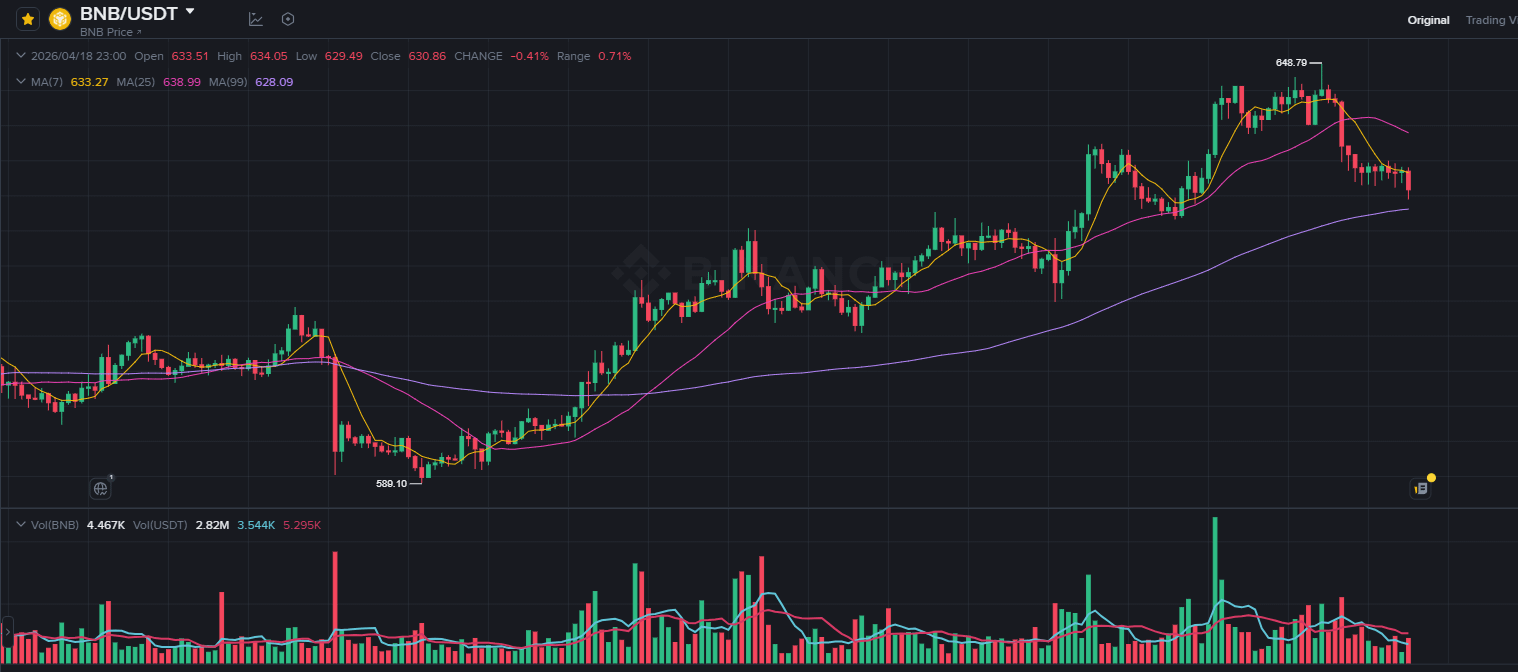
Based on the 1-hour chart provided for April 18, 2026, BNB/USDT is currently trading at $630.86. After reaching a local high of $648.79, the price has retraced and is currently finding support near the 99-period Moving Average (purple line) around the $628 level.
Market Context
Trend: Short-term bearish correction within a larger ascending structure. The price is hovering at a critical dynamic support level.
Support: Immediate support is at $628.00 (99-MA). A significant breakdown below the previous swing low of $589.10 would signal a major trend reversal.
Resistance: Bulls need to clear the $639.00 mark (25-MA) to re-establish bullish momentum toward the recent high of $648.
$BNB Trading Signal: BNB/USDT
Position: Long (Bounce Play)
Entry Zone: $628.50 – $631.50
TP1: $639.00 (25-MA Resistance)
TP2: $644.50 (Recent Consolidation Area)
TP3: $648.80 (Local High Retest)
TP4: $665.00 (Psychological Barrier)
TP5: $685.00 (Major Resistance Extension)
Stop Loss (SL): $619.00 (Placed safely below the current support cluster and recent wicks).