Looking at this BTC/USDT daily chart on Binance, the story is actually quite simple: Bitcoin ran hard… and now it’s cooling off a bit.
Let’s break it down in plain terms.
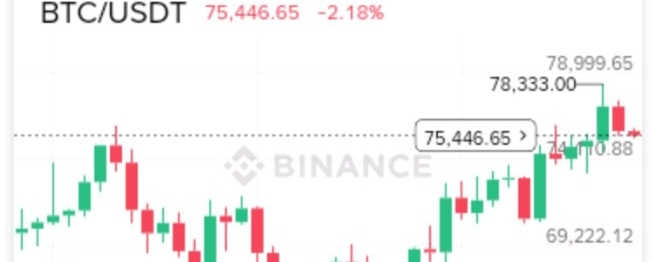
Over the past few weeks, Bitcoin climbed steadily from around $65,000 to nearly $79,000. That’s a strong upward move — the kind that gets traders excited and brings new money into the market. You can clearly see those green candles stacking up, showing consistent buying pressure.
But here’s the thing about markets: they don’t go up in a straight line forever.
Right now, $BTC is sitting around $75,400, down about 2.18% on the day. That small drop might look scary at first glance, but in reality, it’s more like the market catching its breath after a sprint.
🧠 What’s Happening Behind the Scenes?
The zone around $78K–$79K acted as a resistance level — basically a price where many traders decided to take profit.
After hitting that area, sellers stepped in, causing the slight pullback you’re seeing now.
Despite the drop, Bitcoin is still holding above key support levels, especially around $69K–$70K, which is a good sign.
📊 What This Means for Traders
This chart is showing a healthy market structure, not a collapse.
If $BTC stays above support and consolidates, it could build momentum for another move up.
If it loses support, we might see a deeper correction before the next rally.
💬 Real Talk
This is the part many people misunderstand:
A red day doesn’t mean the trend is over.
In fact, pullbacks are necessary. They shake out weak hands and give stronger buyers a chance to re-enter. Right now, the overall trend still leans bullish — just less aggressive than before.
🚀 Final Thoughts
Bitcoin isn’t crashing — it’s pausing.
And in markets, pauses often come right before the next big move.
So instead of panicking, this is the time to watch closely, stay patient, and let the market show its next direction.