I don't cover micro-cap altcoins often, but the COS/USDT chart just printed something worth paying attention to. What happened in the last 48 hours was a textbook liquidity grab — and how price responds from here will tell us everything.
Let me break it down honestly.
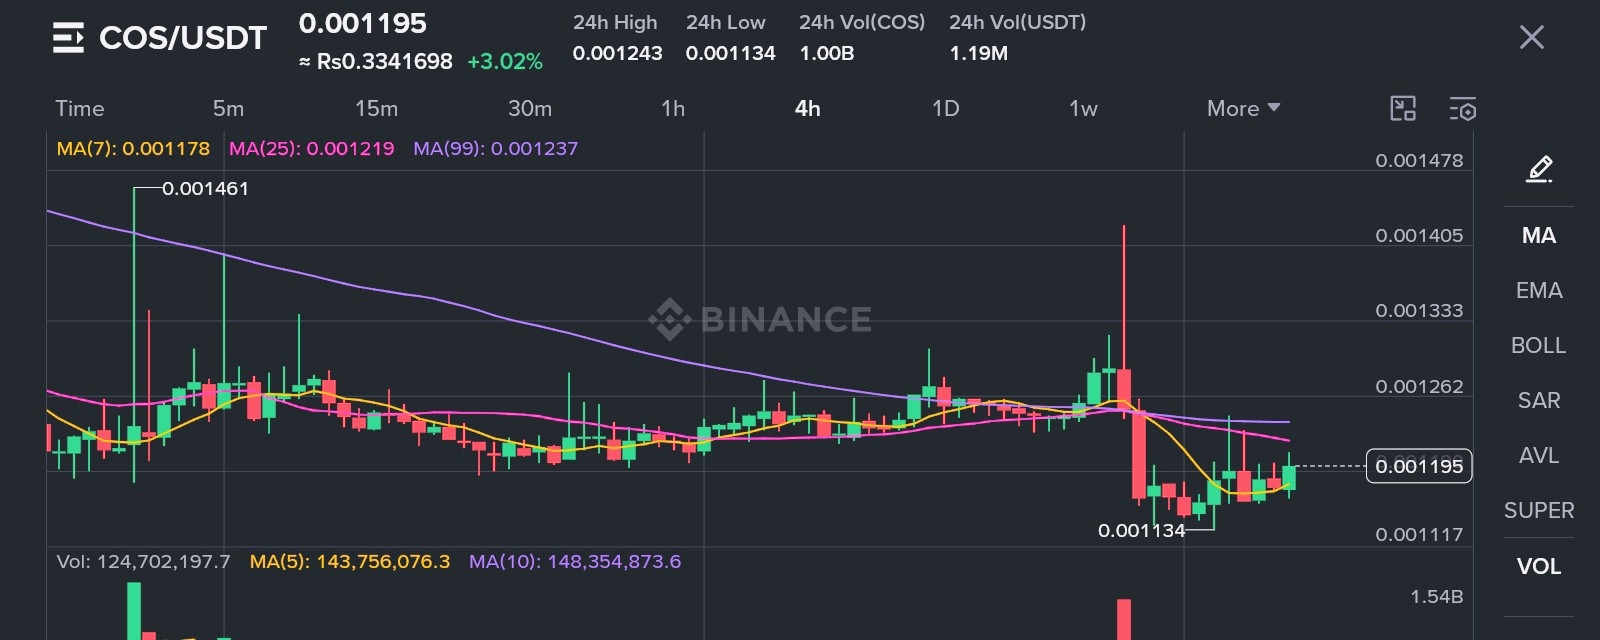
Current price: $0.001195 — up +3.02% today, which sounds encouraging on the surface. But let's not get carried away with a single green candle after what just happened.
The spike and crash on April 19 was brutal.
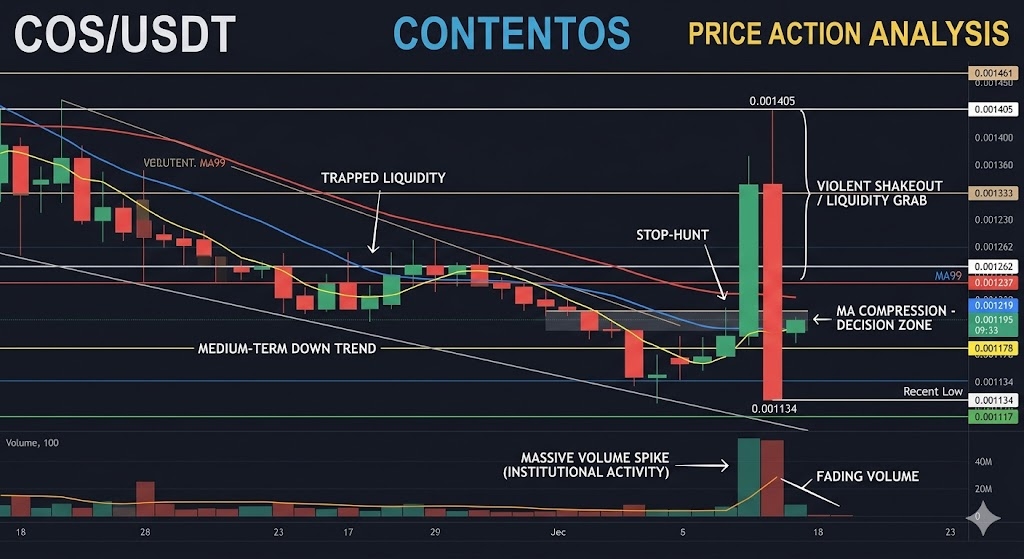
Price briefly wicked up toward the 0.001405 area with an enormous red candle and volume spike hitting 1.54B — that's not organic buying, that's a liquidity event. A stop-hunt. Within the same candle session, price reversed violently and crashed all the way down to 0.001134, the 24H low and a multi-week bottom.
That kind of wick tells you two things: there was trapped liquidity sitting above the range, and sellers were waiting at that level with size. The massive volume on that single candle — dwarfing everything else on the chart — confirms this wasn't retail noise. Something moved deliberately.
The MA structure is compressed and converging — which is actually interesting.
MA(7): 0.001178 → MA(25): 0.001219 → MA(99): 0.001237
All three MAs are sitting within a razor-thin band of just 0.000059 points. That's an unusually tight compression for any asset. When MAs compress this tightly after a volatile event, it typically precedes a directional move — the question is always which direction.
Right now, price at 0.001195 is trading between MA(7) and MA(25), which puts it in a decision zone. A close above MA(25) at 0.001219 and then MA(99) at 0.001237 would shift the short-term structure bullish. A rejection back below MA(7) at 0.001178 reopens the path toward the 0.001134 low.
The longer-term picture adds context.
Cast your eye back to the chart's left side — COS previously traded up at 0.001461 in early April before a steady, grinding decline through mid-month. That peak now acts as distant overhead resistance. The MA(99) has been in a persistent downtrend throughout the entire visible chart period, which tells you the medium-term trend is still not in buyers' favor.
Volume is fading after the spike — watch this closely.
Current volume at 124.7M is meaningfully below both MA(5) at 143.8M and MA(10) at 148.4M. The massive spike volume during the April 19 wick has already dissipated. For any bullish recovery to be credible, volume needs to come back with green candles — not just a low-volume drift upward.
Key levels I'm watching:
Immediate resistance: 0.001219 (MA25) → 0.001237 (MA99) → 0.001262
Support: 0.001178 (MA7) → 0.001134 (recent low) → 0.001117
Major overhead: 0.001333 → 0.001405 → 0.001461 (April high)
The setup in plain language:
COS just went through a violent flush. Those kinds of events sometimes mark the end of a selling cycle — smart money shakes out weak hands, accumulates at the lows, and price quietly recovers. But they can also be the beginning of a deeper breakdown if buyers don't step up with conviction.
The +3.02% today is a start. But I need to see a clean reclaim of 0.001237 with expanding volume before I'd call this anything more than a dead cat bounce.
Patience is the edge right now. Let price prove itself.
Not financial advice. Always do your own research and never risk more than you can afford to lose.
What's your read on COS? Is this a shakeout bottom or just a pause before more downside? Drop your thoughts below. 👇
#Contentos #COSUSDT #CryptoAnalysis #AltcoinWatch #TechnicalAnalysis
