Witamy w Części 2 mojej serii dla początkujących w handlu.
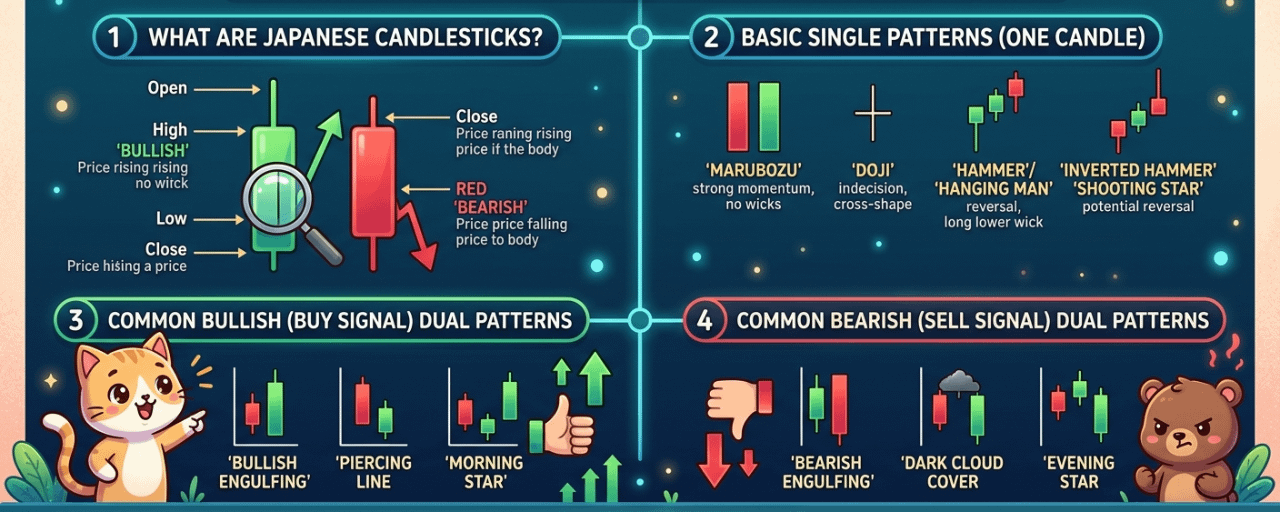
Poniżej znajduje się wizualna referencja najpotężniejszych wzorców świecowych. Oto, co każdy wzorzec sygnalizuje:
🔴 Pojedyncze Wzory Świec
WzórKształtZnaczenieDojiOtwarcie = Zamknięcie, długie knoty po obu stronachNiepewność rynku. Kupujący i sprzedający są na równi. Może nadchodzić odwrócenie trendu.MłotMałe ciało na górze, długi dolny knotByczy sygnał odwrócenia (pojawia się na dnie trendu spadkowego). Kupujący wchodzą na rynek.Wiszacy CzłowiekTaki sam kształt jak Młot, ale pojawia się na szczycie trendu wzrostowegoOstrzeżenie o niedźwiedzim odwróceniu. Sprzedający zaczynają odrzucać wyższe ceny.Gwiazda SpadającaMałe ciało na dole, długi górny knotNiedźwiedzi sygnał odwrócenia (pojawia się po trendzie wzrostowym). Kupujący próbowali podnieść ceny, ale nie udało im się.Odwrotny MłotMałe ciało na dole, długi górny knot (pojawia się na dnie)Byczy sygnał odwrócenia – kupujący testują wyższe ceny.
🟢 Wzorce odwrócenia wzrostowego z dwóch świec
WzorzecOpisSygnałByczy objęcieDuża zielona świeca całkowicie "pożera" poprzednią małą czerwoną świecę.Silna presja zakupowa. Trend prawdopodobnie wzrostowy.Wzorzec przebiciaZielona świeca zamyka się w więcej niż połowie ciała poprzedniej czerwonej świecy.Bycza odwrócenie po trendzie spadkowym.Gwiazda porannaMała świeca (Doji lub Młot) między długą czerwoną a długą zieloną świecą.Potężny wzór odwrócenia. Świt nowego trendu wzrostowego.Byczy Harami CrossDoji wewnątrz ciała poprzedniej czerwonej świecy.Niezdecydowanie po trendzie spadkowym. Możliwe odwrócenie.Dno TweezerDwie świece z taką samą najniższą ceną (pierwsza czerwona, potem zielona).Wsparcie jest silne. Kupujący bronią tego poziomu.
🔴 Wzorce odwrócenia spadkowego z dwóch świec
WzorzecOpisSygnałNiedźwiedzie objęcieDuża czerwona świeca całkowicie "pożera" poprzednią małą zieloną świecę.Silna presja sprzedażowa. Trend prawdopodobnie spadkowy.Ciemna chmuraZamknięcie czerwonej świecy w więcej niż połowie ciała poprzedniej zielonej świecy.Niedźwiedzie odwrócenie po trendzie wzrostowym.Gwiazda wieczornaMała świeca między długą zieloną a długą czerwoną świecą.Potężne niedźwiedzie odwrócenie. Koniec trendu wzrostowego.Niedźwiedzi Harami CrossDoji wewnątrz ciała poprzedniej zielonej świecy.Niezdecydowanie po trendzie wzrostowym. Możliwe odwrócenie.Szczyt TweezerDwie świece z taką samą najwyższą ceną (pierwsza zielona, potem czerwona).Opór jest silny. Sprzedający odrzucają ten poziom.
📊 Trzy lub więcej wzorców świecowych
WzorzecOpisSygnałTrzy białe żołnierzeTrzy kolejne długie zielone świece, z każdą zamykającą się blisko swojego szczytu.Bardzo silny byczy momentum. Trend wzrostowy jest zdrowy.Trzy czarne krukiTrzy kolejne długie czerwone świece, z każdą zamykającą się blisko swojego dołka.Bardzo silny niedźwiedzi momentum. Trend spadkowy przyspiesza.Trzy metody wzrostoweDługa zielona świeca, następnie 3 małe czerwone świece (wszystkie wewnątrz zielonego ciała), następnie kolejna długa zielona świeca.Ciągłość trendu wzrostowego. Małe czerwone świece to tylko pauza.Trzy metody spadkoweDługa czerwona świeca, następnie 3 małe zielone świece (wszystkie wewnątrz czerwonego ciała), następnie kolejna długa czerwona świeca.Ciągłość trendu spadkowego. Małe zielone świece to tylko pauza.
💡 Jak wykorzystać ten przewodnik w swoim tradingu
Nigdy nie polegaj tylko na jednym wzorze. Zawsze sprawdzaj trend i czekaj na potwierdzenie.
Im wyższy interwał czasowy (4H, dzienny), tym silniejszy sygnał.
Łącz wzorce z poziomami wsparcia/oporu dla najlepszych wejść.
⚠️ Pamiętaj: Żaden wzór nie działa w 100% przypadków. Zawsze używaj stop-loss.
✅ Koniec przewodnika
Teraz masz kompletny przewodnik po najważniejszych wzorcach świecowych. Dodaj tę stronę do zakładek lub zapisz na następną sesję tradingową.
📚 Kompletna seria dla początkujących (Część 1, 2 i 3)
Część 1: Od zera do analityka: Przewodnik dla początkujących po świecach i trendach rynkowych
Część 2: Jesteś tutaj 👆
Część 3: Wsparcie i opór: Ostateczny przewodnik po znajdowaniu poziomów wejścia i wyjścia
#CandlestickPatterns #TechnicalAnalysis #Bitcoin #CryptoTrading #BinanceSquare
$BTC $ETH $BNB


