Witaj w Części 3 mojej serii dla początkujących w handlu.
W Części 1 nauczyliśmy się, czym są świeczki i jak identyfikować trendy. W Części 2 zbadaliśmy potężne wzory świecowe, takie jak Doji, Młotek i Zasysający.
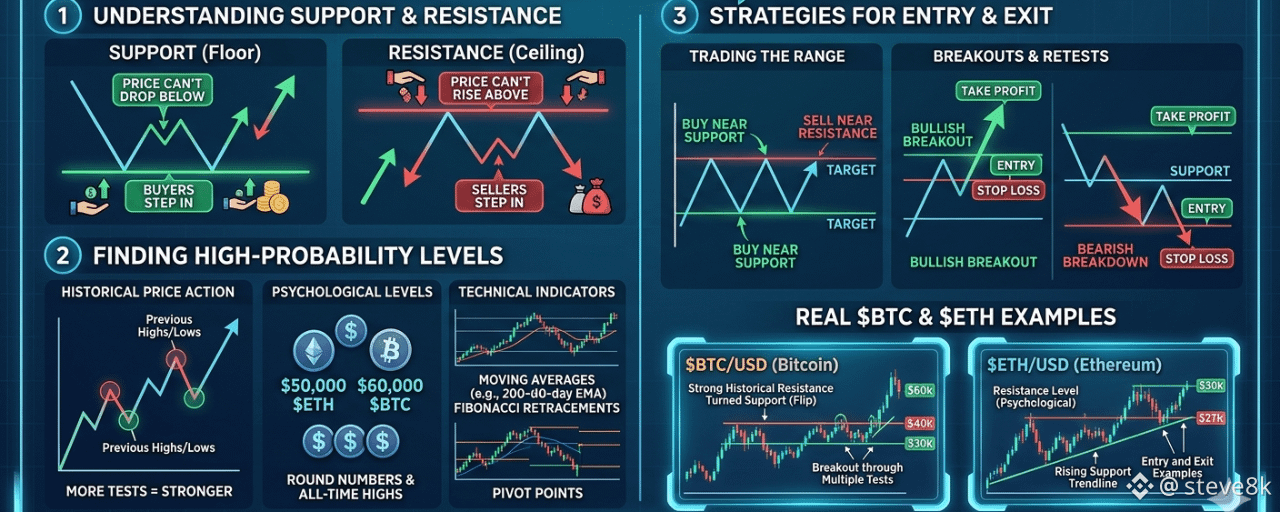
Teraz nadszedł czas, aby nauczyć się najważniejszej umiejętności ze wszystkich: Znajdowanie poziomów wsparcia i oporu.
To są "ściany" na wykresie, gdzie cena ma tendencję do zatrzymywania się i odwracania. Gdy to opanujesz, będziesz wiedział dokładnie, gdzie wejść, zrealizować zysk i ustawić stop-loss.
🧱 Część 1: Czym są wsparcie i opór?
Myśl o cenie jak o piłce odbijającej się między podłogą a sufitem.
KoncepcjaDefinicjaCo się dzieje?Wsparcie (Podłoga) 🟢Poziom cenowy, na którym presja kupna jest na tyle silna, aby zatrzymać dalszy spadek ceny.Cena odbija się W GÓRĘ od wsparcia.Opór (Sufit) 🔴Poziom cenowy, na którym presja sprzedaży jest na tyle silna, aby zatrzymać dalszy wzrost ceny.Cena odbija się W DÓŁ od oporu.
Przykład z $BTC:
Jeśli Bitcoin spadnie do $70,000 i odbije się trzy razy → $70,000 to mocne wsparcie.
Jeśli Bitcoin wzrośnie do $75,000 i zostanie odrzucony trzy razy → $75,000 to mocny opór.
🔄 Część 2: Najważniejsza zasada – Role się odwracają
To jest złota zasada w tradingu, którą większość początkujących ignoruje:
Gdy wsparcie zostanie przełamane, staje się oporem.
Gdy opór zostanie przełamany, staje się wsparciem.
Wizualny przykład:
Przed: Cena szanuje $70,000 jako wsparcie (odbija się 3 razy).
Złamanie: Cena spada PONIŻEJ $70,000.
Po: Cena próbuje wrócić w górę, ale teraz $70,000 działa jako opór (cena zostaje odrzucona w dół).
Tak zmieniają się trendy. Złamane wsparcie sygnalizuje potencjalny trend spadkowy. Złamany opór sygnalizuje potencjalny trend wzrostowy.
📊 Część 3: Jak zidentyfikować mocne i słabe poziomy
Nie wszystkie linie wsparcia/oporu są sobie równe. Niektóre są silniejsze.
CechaMocny poziom ✅Słaby poziom ⚠️Liczba testówDotknięte 3+ razyDotknięte tylko razRamka czasowaPojawia się na wykresie Dziennym lub TygodniowymPojawia się na wykresie 5-min lub 15-minReakcja świecowaDługie knoty lub silne świecowe odbiciaMałe knoty lub ruch bocznyWolumenWysoki wolumen na poziomieNiski wolumen
💡 Porada Pro: Poziom wsparcia/oporu na ramie czasowej Dziennym jest znacznie silniejszy niż na wykresie 1-godzinnym. Zawsze zaczynaj swoją analizę od wyższych ram czasowych.
🛠️ Część 4: Prosta strategia tradingowa w 3 krokach z użyciem wsparcia/oporu
Oto praktyczna strategia, którą możesz zastosować już dziś:
Krok 1: Zidentyfikuj kluczowe poziomy
Otwórz wykres 4-godzinny lub dzienny dla $BTC lub $ETH.
Narysuj poziome linie tam, gdzie cena gwałtownie odbiła się w ciągu ostatnich 2-4 tygodni.
Krok 2: Czekaj, aż cena osiągnie jeden z tych poziomów
Jeśli cena spadnie do mocnego wsparcia → szukaj sygnałów kupna.
Jeśli cena wzrośnie do mocnego oporu → szukaj sygnałów sprzedaży.
Krok 3: Czekaj na potwierdzenie (BARDZO WAŻNE)
Nie kupuj od razu, gdy cena dotyka wsparcia.
Czekaj na bullish pattern świecowy (Hammer, Bullish Engulfing itp.) na wsparciu.
Potem wejdź w transakcję.
Przykład z $ETH:
Ethereum znajduje się na wsparciu $2,300 (testowane 3 razy wcześniej).
Cena dotyka $2,300 i formuje świecę Hammer.
Kupujesz z zleceniem stop-loss tuż poniżej $2,290.
🚨 Część 5: Najczęstsze błędy początkujących
BłądDlaczego to jest błędnePoprawkaKupowanie dokładnie na wsparciu bez potwierdzeniaCena może natychmiast przełamać wsparcie.Czekaj na świecę odwrócenia bullish.Sprzedaż dokładnie na oporze bez potwierdzeniaCena może przełamać opór i kontynuować wzrost.Czekaj na świecę odwrócenia bearish.Używanie poziomów z bardzo starych danych (6+ miesięcy)Warunki rynkowe się zmieniają. Stare poziomy mogą już nie mieć znaczenia.Skoncentruj się na poziomach utworzonych w ciągu ostatnich 4-8 tygodni.Rysowanie zbyt wielu liniiZamieszanie prowadzi do złych decyzji.Utrzymuj tylko 2-3 najbardziej oczywiste poziomy.
✅ Kluczowe wnioski
Wsparcie = podłoga (cena odbija się w górę). Opór = sufit (cena odbija się w dół).
Role się odwracają: Złamane wsparcie staje się oporem. Złamany opór staje się wsparciem.
Wyższa rama czasowa = silniejszy poziom.
Zawsze czekaj na potwierdzenie świec przed wejściem w transakcję.
Łącz wsparcie/opór z wzorami świecowymi (z Części 2) dla najlepszych wyników.
💬 Teraz twoja kolej
Jaki jest twój największy problem z wsparciem i oporem?
Czy masz problem z rysowaniem odpowiednich poziomów?
Czy wchodzisz za wcześnie bez potwierdzenia?
Czy ignorujesz wyższe ramy czasowe?
Zostaw swoją odpowiedź w komentarzach poniżej 👇
Rośnijmy razem jako traderzy!
📚 Seria dla Całkowitych Początkujących (Część 1, 2 i 3)
Część 1: Z Zera do Analityka: Świece i Trendy
Część 2: Kompletny przewodnik po japońskich wzorach świecowych
Część 3: Jesteś tutaj 👆
#SupportAndResistance #TechnicalAnalysis #Bitcoin #Ethereum #BinanceSquare