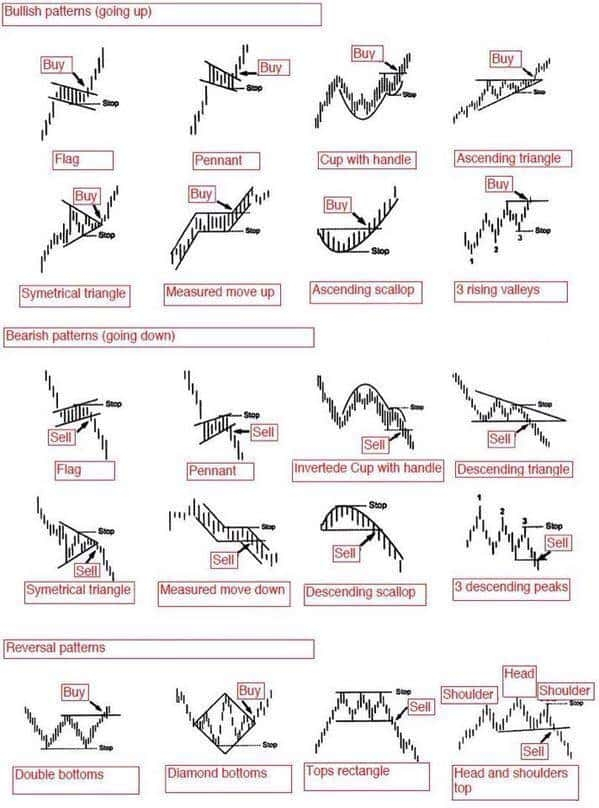
In trading, chart patterns are an important way to understand price action. Bullish patterns are those that signal an upward move or increasing prices. These include patterns like Flag, Pennant, Cup with Handle, Ascending Triangle, and Ascending Scallop. They usually represent strong buying pressure and continuation of an uptrend, where the market first consolidates and then starts the next bullish move.
On the other hand, bearish patterns indicate a downward move or falling prices. These include Descending Triangle, Inverted Cup with Handle, Measured Move Down, Descending Scallop, and Head & Shoulders Top. These patterns suggest that buyers are weakening while sellers are gaining control, which can lead to further price decline.
Reversal patterns are especially important because they signal a possible change in trend. Double Bottom and Diamond Bottom indicate bullish reversals, meaning the price may start moving upward after a downtrend. Meanwhile, Head & Shoulders Top and Rectangle Top indicate bearish reversals, where a strong uptrend may end and a downtrend could begin.
Finally, it is important to remember that no pattern guarantees results. These are only probability-based tools that help understand market psychology. Always wait for confirmation such as volume, support/resistance levels, and overall market structure, and always apply proper risk management when trading.