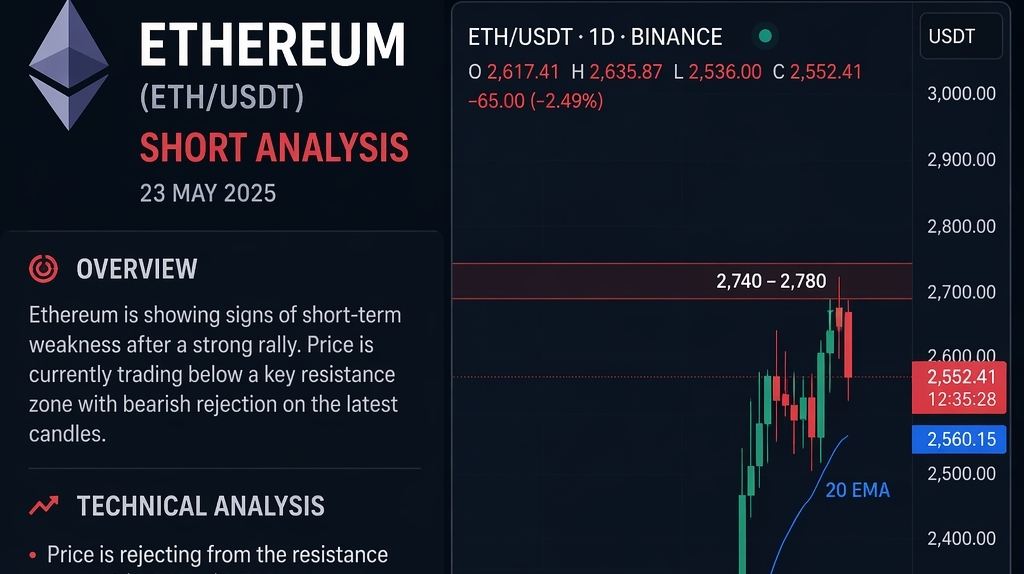
$ETH 📊 Ethereum (ETH) Short Analysis
🧭 Overview
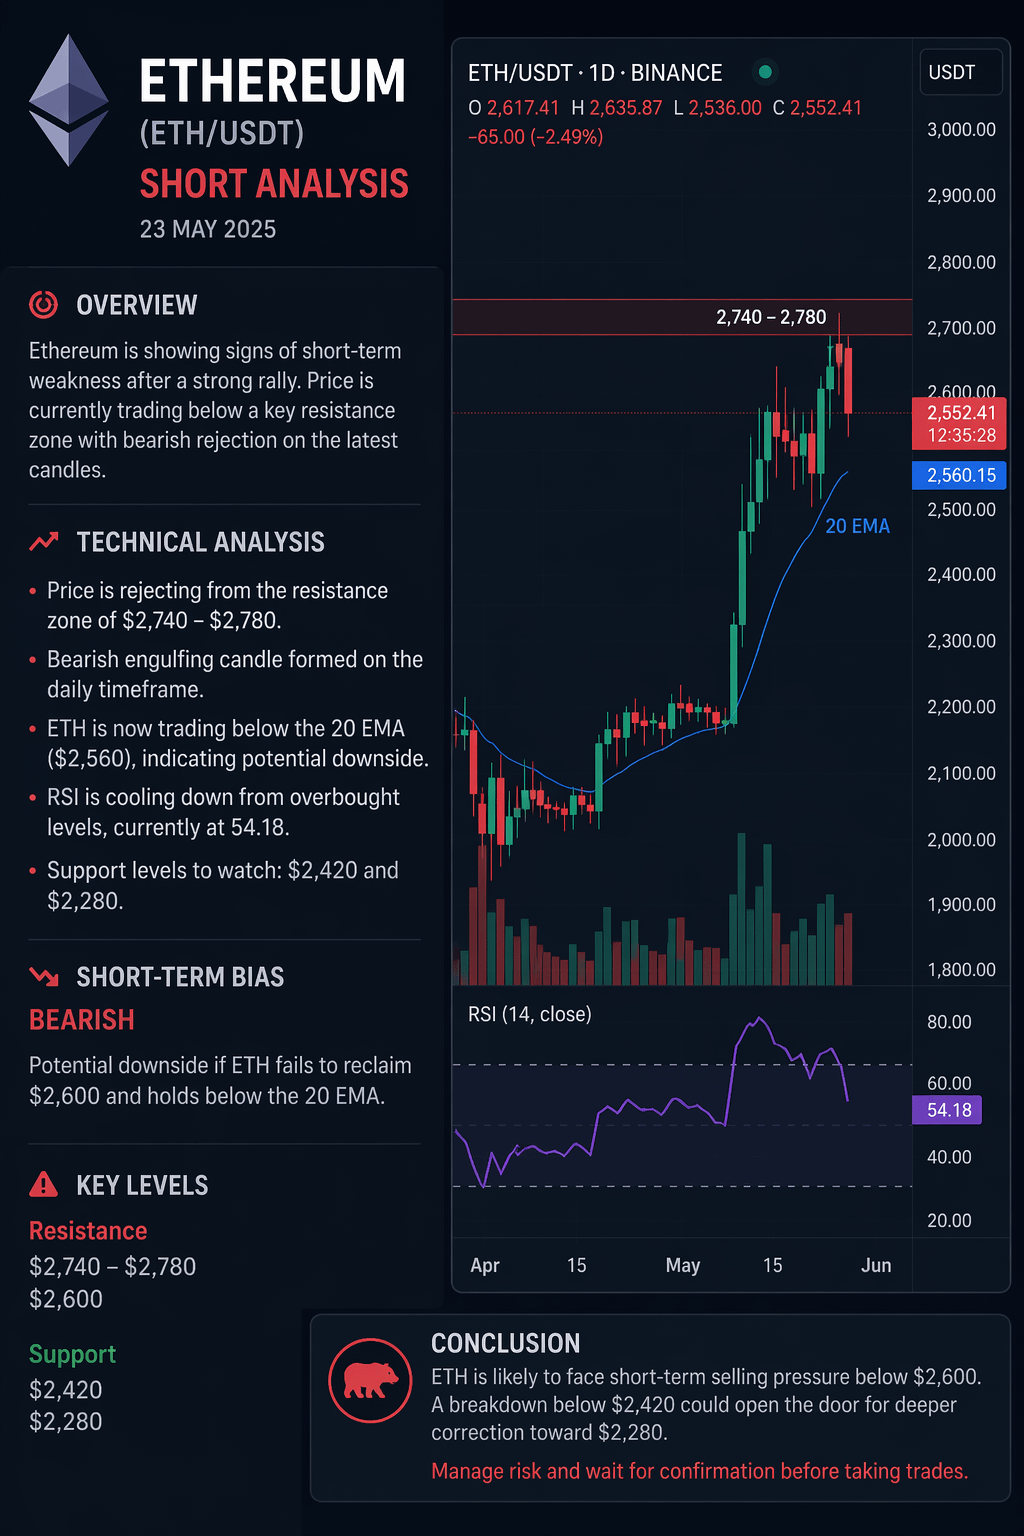
Ethereum is showing short-term weakness after a strong bullish rally. Price is currently struggling below a key resistance zone, with recent candles indicating seller pressure.
📉 Technical Analysis
Resistance Zone: $2,740 – $2,780
Current Price Area: Around $2,550
EMA (20): Price trading slightly below → bearish signal
RSI: Cooling off from overbought (~54)
Candle Structure: Bearish rejection + possible engulfing
👉 This suggests momentum is slowing down and sellers are stepping in.
⚠️ Key Levels
Resistance: $2,600 → $2,780
Support: $2,420 → $2,280
📉 Short-Term Bias: BEARISH
If $ETH fails to reclaim $2,600, expect more downside
A break below $2,420 could trigger a deeper correction
🧠 Trade Idea (Short Setup)
Entry: Below $2,550
Target: $2,420 → $2,280
Invalidation: Above $2,620
⚡ Conclusion
Ethereum is in a cool-off phase. Until buyers regain control above resistance, the market favors short-term downside or consolidation.
#JustinSunSuesWorldLibertyFinancial #StrategyBTCPurchase #JointEscapeHatchforAaveETHLenders