
Volume analysis is an effective way to gauge the strength of an ongoing trend and identify whether market dynamics are beginning to shift.
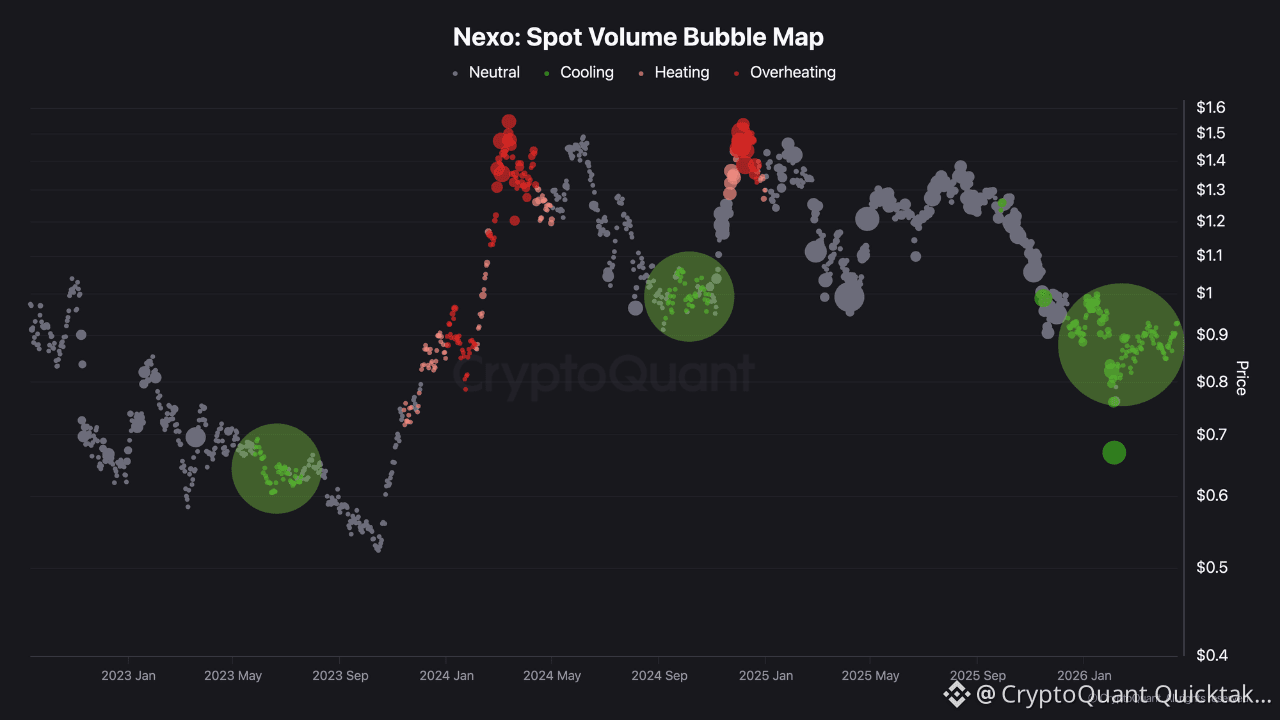
The chart illustrates the evolution of spot trading volumes through a bubble map, making it easier to identify distinct market phases.
These phases can reflect investor FOMO, when a surge of capital accelerates price appreciation, or conversely a period of low engagement when activity slows.
Each configuration generally calls for a different strategic approach.
An interesting signal is currently emerging on Nexo.
The market appears to have entered a cooling volume phase, meaning the ongoing corrective trend is gradually losing momentum. Selling pressure is weakening, and sellers appear less aggressive than before.
This setup has occurred twice in relatively recent history.
The first instance came in May 2023, when NEXO was trading around $0.60, ahead of a roughly 150% rally toward the $1.50 area. Volumes later moved into an overheated phase as that move extended.
The second occurrence came in September 2023 and preceded a price rally of around 65%.
While the current structure may suggest a similar scenario could unfold, today's market environment is different and caution remains warranted.
This signal is worth monitoring, but it would benefit from confirmation through a gradual return of buying volumes and a clearer recovery in overall price momentum.
Written by Darkfost