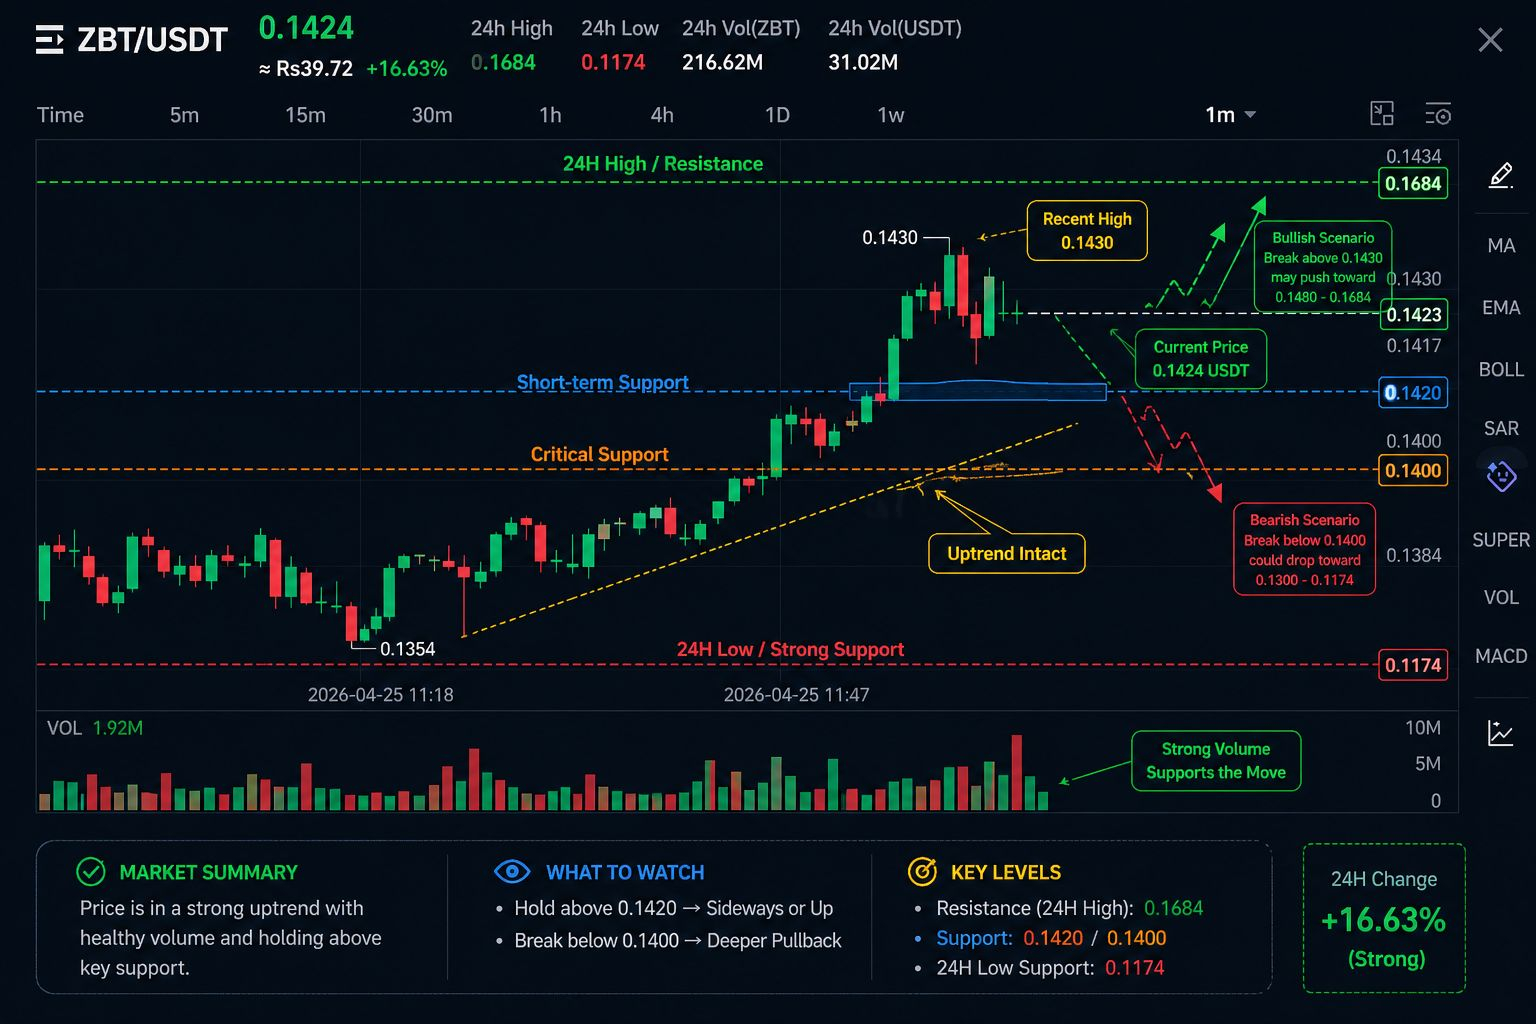
$ZBT has delivered an impressive move, climbing sharply to around 0.1424 USDT with a +16.63% gain in 24 hours. The rally caught attention quickly, but now the market is showing early signs of slowing down after the spike.
📊 Strong Move Backed by Volume
This wasn’t a weak pump. The move came with heavy trading activity:
ZBT Volume: 216.62M
USDT Volume: 31.02M
High volume usually confirms that the price move has real participation behind it. That’s why the rally looks strong rather than random.
📍 Key Price Levels
24H High: 0.1684
24H Low: 0.1174
Right now, price is sitting comfortably above the middle of this range. That’s a good sign—it shows buyers are still holding control even after the pullback.
⏱️ What the Short-Term Chart Shows
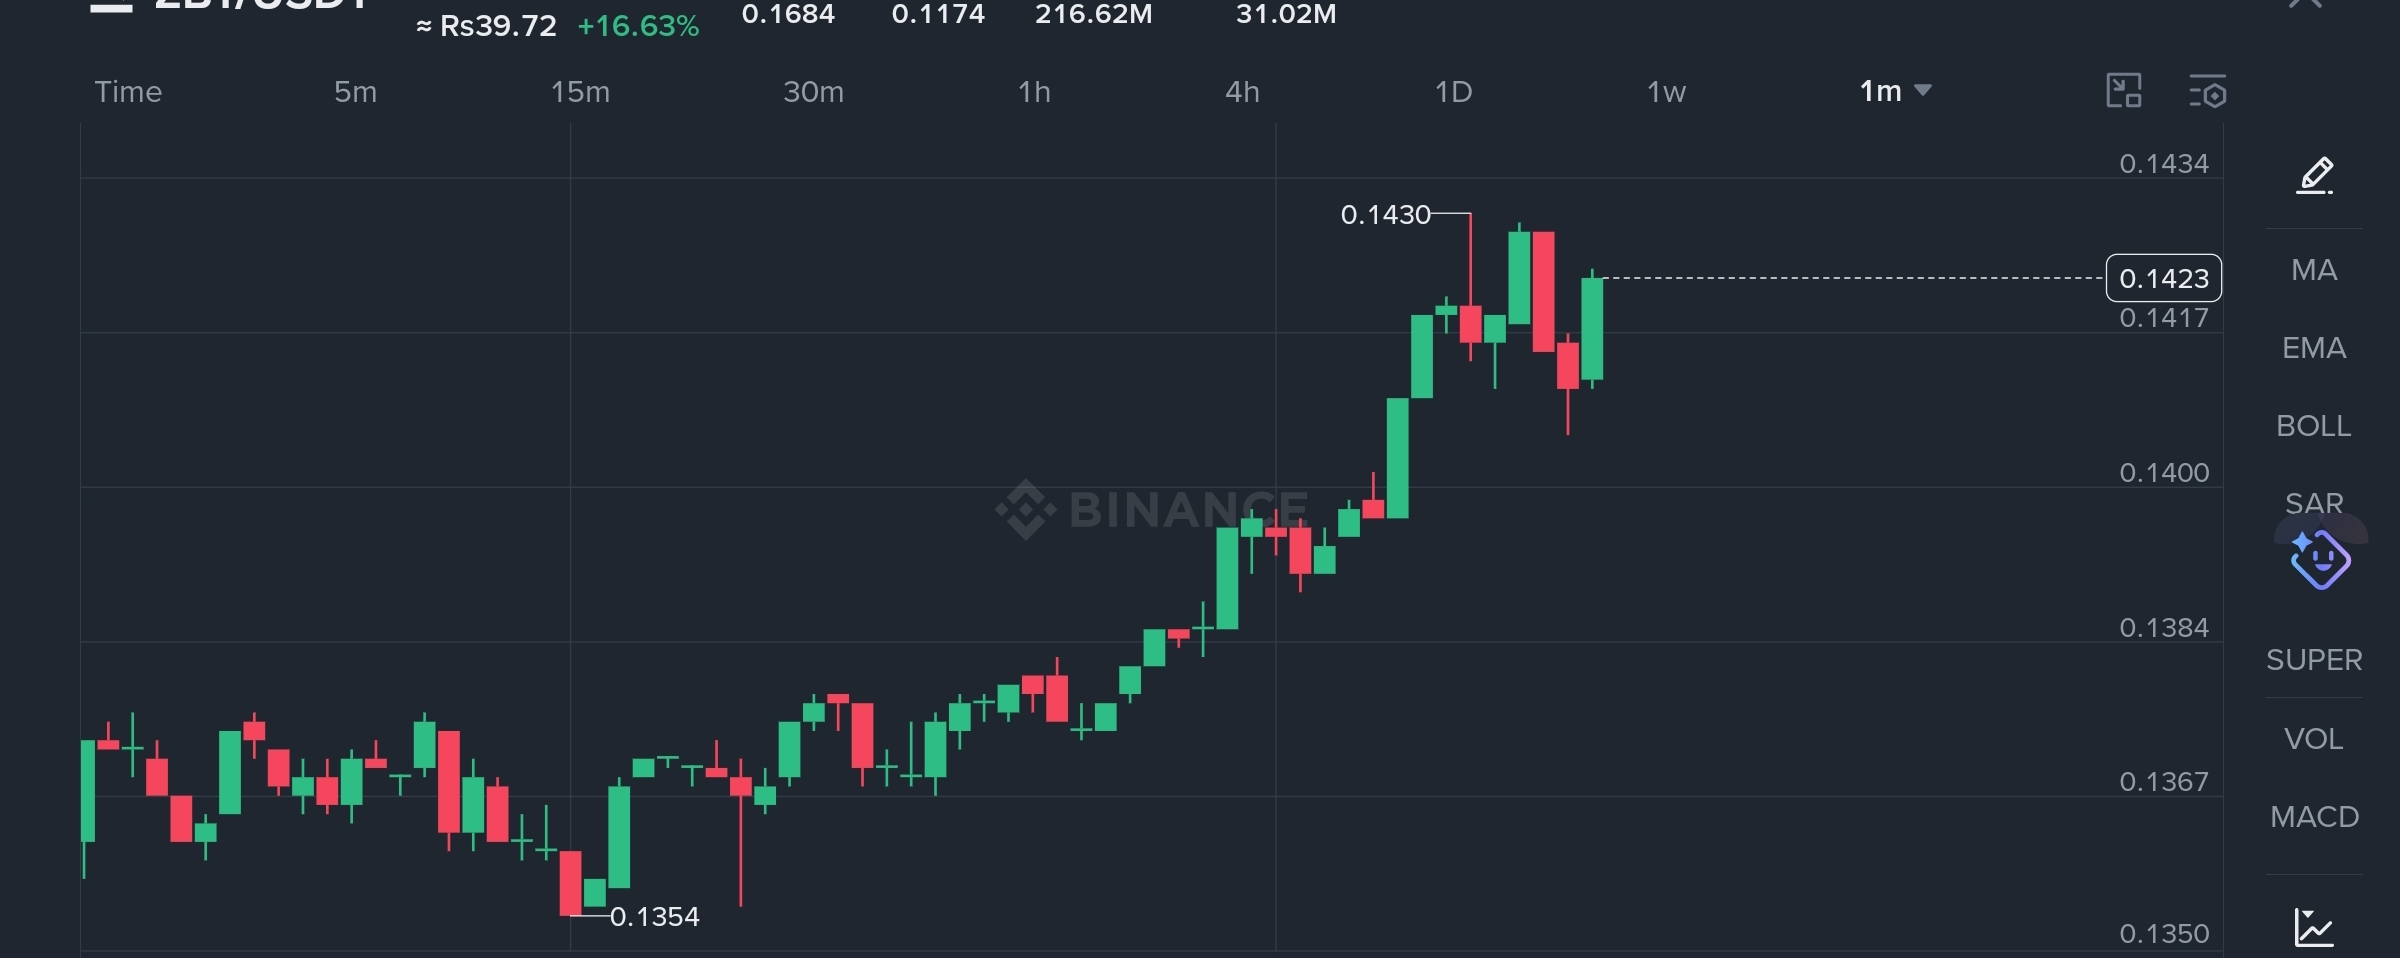
Looking at the lower timeframe (5-minute chart):
Price pushed up fast and peaked near 0.1430
After that, it pulled back slightly to around 0.1423–0.1424
Candles are now forming lower highs, which usually means momentum is cooling
But here’s the important part:
👉 The price is not dropping fast — it’s moving sideways. That means traders are taking profits, not panicking.
🔎 What to Watch Next
Holding above 0.1420:
This keeps the bullish structure intact. Price may continue sideways before another push up.
Break below 0.1400:
This could open the door for a deeper pullback, possibly toward lower support zones.
🧠 Simple Takeaway
$ZBT is still in a strong uptrend, but after such a fast move, a pause is normal. Think of it like a runner slowing down to catch breath before the next sprint.
If buyers defend current levels, the trend can continue. If not, expect a healthy correction before the next move.
#zbt #MarketSentimentToday #ETH #BTC