
Key Highlights
MultiversX (EGLD) is forming a bullish Adam and Eve double bottom pattern on the daily chart, signaling a potential trend reversal.
Price is approaching the key 100-day moving average at $4.51, which is acting as immediate resistance.
A breakout above $5.37 neckline resistance could trigger a rally toward the $7.05 target.
Failure to reclaim the 100 MA may lead to a pullback toward the $3.98 support zone.
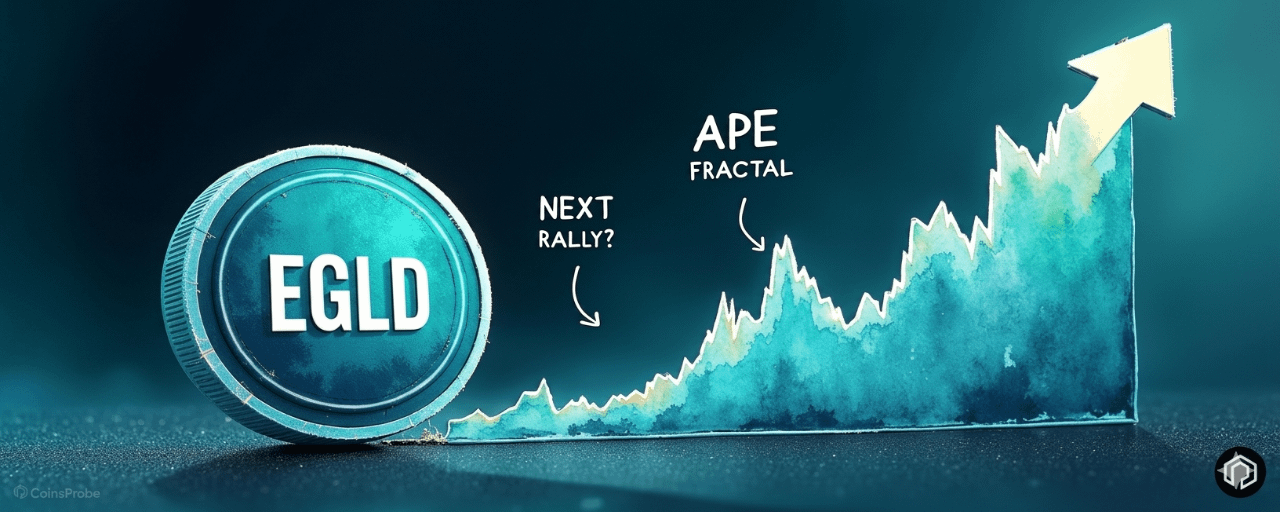
The crypto market has seen a burst of momentum over the past 24 hours, led by Apecoin’s explosive 71% rally. While many traders may feel they missed that move, another gaming-focused token — MultiversX (EGLD) — is quietly showing signs of a similar bullish setup.
$EGLD has already gained above 6% today, and its chart structure suggests that a larger move could be brewing if key confirmations fall into place.
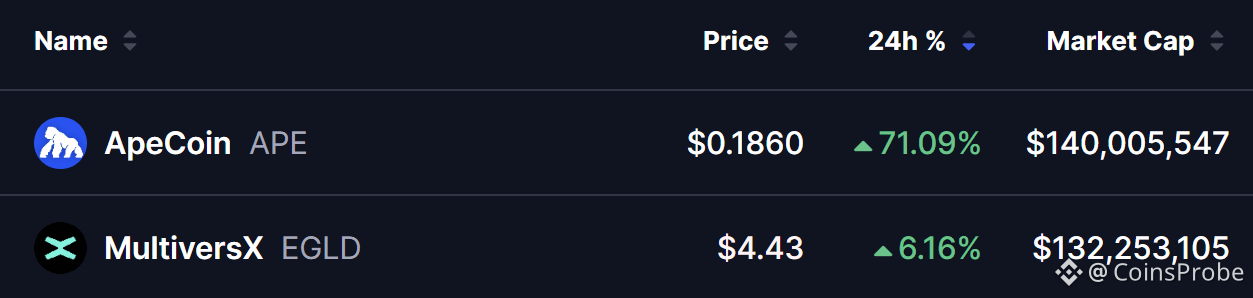 APE and EGLD Prices/Source: Coinmarketcap
Bullish “Adam and Eve” Pattern Taking Shape
On the daily timeframe, EGLD appears to be forming a classic Adam and Eve double bottom — a well-known bullish reversal pattern that often signals the transition from a downtrend to an uptrend.
The structure began after EGLD faced rejection near the $5.37 resistance level in late January 2026. Following that:
The first bottom formed sharply near $3.69, creating the “Adam” leg (a V-shaped drop and recovery).
The second bottom developed more gradually and rounded, forming the “Eve” structure in the same price zone.
This combination typically reflects a shift in market psychology — from panic selling to steady accumulation.
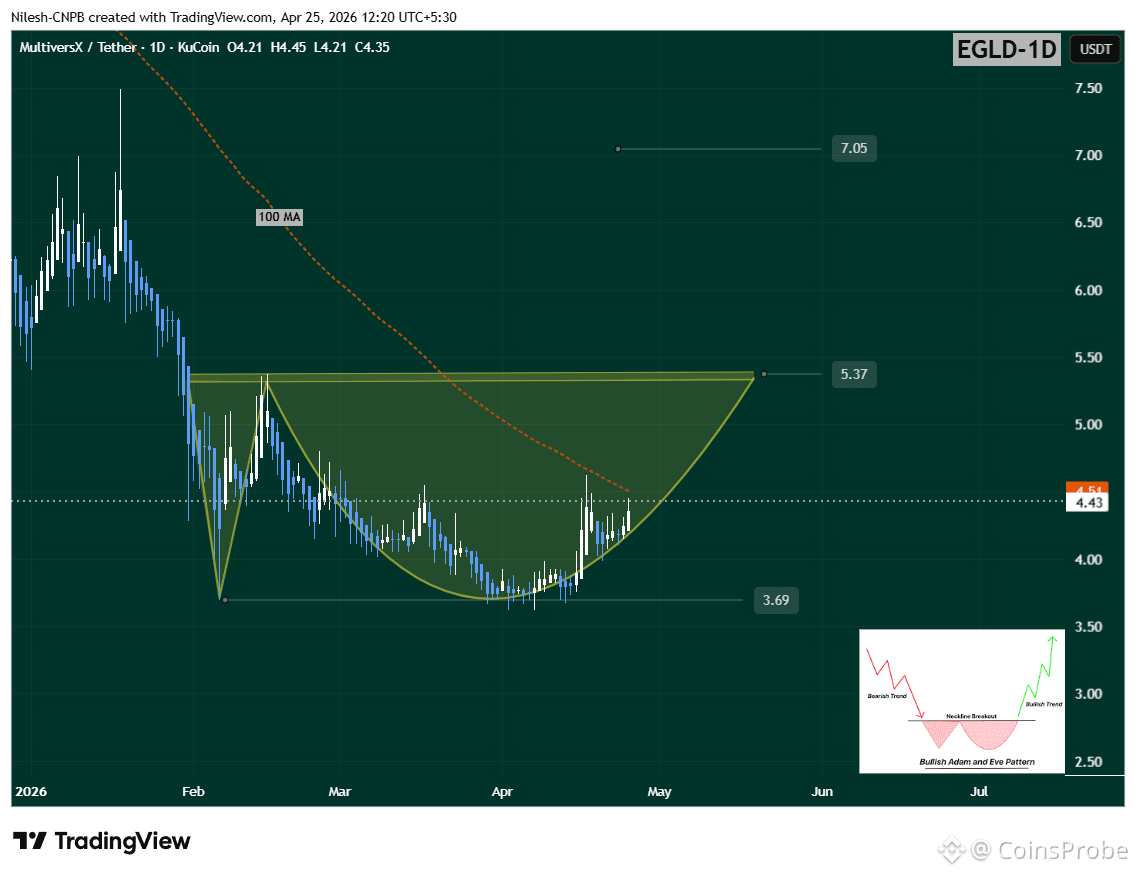 MultiversX (EGLD) Daily Chart/Coinsprobe (Source: Tradingview)
Since then, EGLD has been steadily climbing, building the right side of the pattern and attempting to regain strength.
Key Resistance Still in Play
At the moment, EGLD is trading around the mid-$4 range and is approaching a crucial barrier — the 100-day moving average near $4.51.
This level has acted as strong resistance in recent sessions, making it the immediate hurdle bulls need to overcome for further upside.
What Could Happen Next?
If the pattern continues to play out as expected, the next moves become relatively clear:
Bullish Scenario:
A confirmed breakout above the 100-day MA ($4.51) could open the door for a move toward the neckline resistance at $5.37.If buyers manage to push above this level, it would confirm the pattern breakout and potentially trigger a rally toward the $7.05 zone — representing a strong upside from current levels.
Bearish Scenario:
If EGLD fails to reclaim the 100-day MA, momentum could weaken in the short term. In that case, the price may retest support around the $3.98 area, which becomes critical to hold to maintain the bullish structure.
Final Take
While Apecoin has already made its move, EGLD might still be in the early stages of its setup. The Adam and Eve pattern, combined with improving price action, suggests that a breakout could be approaching — but confirmation is key.
For now, all eyes remain on the $4.51 level. A decisive move above it could be the trigger that shifts EGLD into a stronger bullish phase.
FAQ Section
What pattern is EGLD forming right now?
EGLD is forming a bullish Adam and Eve double bottom pattern, which often signals a reversal from downtrend to uptrend.
What is the key resistance level for EGLD?
The immediate resistance is the 100-day moving average at $4.51, followed by the neckline resistance at $5.37.
What is the bullish target for EGLD?
If EGLD breaks above $5.37, the next major target is around $7.05.
Is EGLD following APE’s recent rally?
EGLD is showing a similar recovery structure, but it still needs confirmation before a strong breakout move.
Disclaimer: The views and analysis presented in this article are for informational purposes only and reflect the author’s perspective, not financial advice. Technical patterns and indicators discussed are subject to market volatility and may or may not yield the anticipated results. Investors are advised to exercise caution, conduct independent research, and make decisions aligned with their individual risk tolerance.