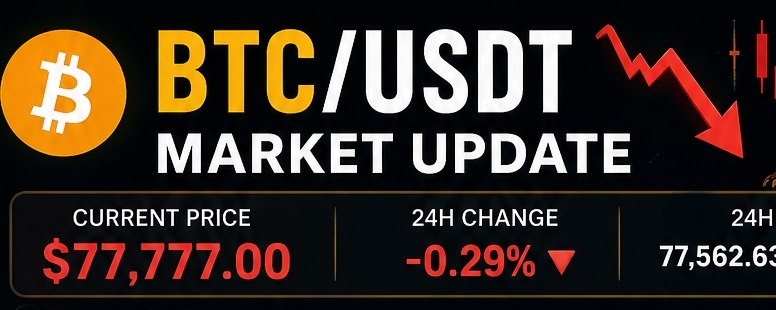
$BTC Bitcoin obecnie handluje w okolicach $77,777, krążąc blisko swojego dziennego minimum ⚠️ — a akcja cenowa wyraźnie pokazuje oznaki słabości.
Po odrzuceniu w pobliżu strefy $79.4K ❌, $BTC przesunął się w krótkoterminowy trend spadkowy. Na niższych ramach czasowych (1H/4H) struktura jest jasna: niższe szczyty ⬇️ i niższe dołki ⬇️, utrzymując presję niedźwiedzi.
📊 Co mówią wskaźniki:
Średnie kroczące są powyżej ceny 📉 — działają jako opór
Bollinger Bands: cena przylega do dolnej wstęgi 📉 (silna presja sprzedaży)
Punkty SAR powyżej świeczek 🔴 — potwierdzają trend spadkowy
Zbieżność MACD na niedźwiedzim crossoverze 🔻 — momentum wciąż słabe
Wolumen: sprzedający dominują 📊, jeszcze brak silnych zakupów
📌 Kluczowe poziomy do obserwacji:
Wsparcie: $77,560 🧱 → przebicie = $77K → $76.8K
Opór: $78,250, $78,600, $79K 🚧
🔍 Prognoza: Dopóki BTC pozostaje poniżej $78.2K, niedźwiedzi bias pozostaje ⬇️
Ruch powyżej $78.6K może osłabić setup shortowy 🔄
Uważaj na fałszywe wybicie ⚠️ poniżej $77.5K — szybkie odbicie = możliwy short squeeze 🚀
W przeciwnym razie, kontynuacja spadków jest prawdopodobna 📉
💡 Strategia: Short na korektach 📉
Zasięg wejścia: $77.9K – $78.1K
Stop Loss: $78.4K ❌
Cele: $77.5K → $77K 🎯
Bądź czujny ⚡ — ten rynek to teraz kwestia momentum.
#BTC #Market_Update #Ethereum #btc走勢


Sol
