Current Price Action of $SOL #solana
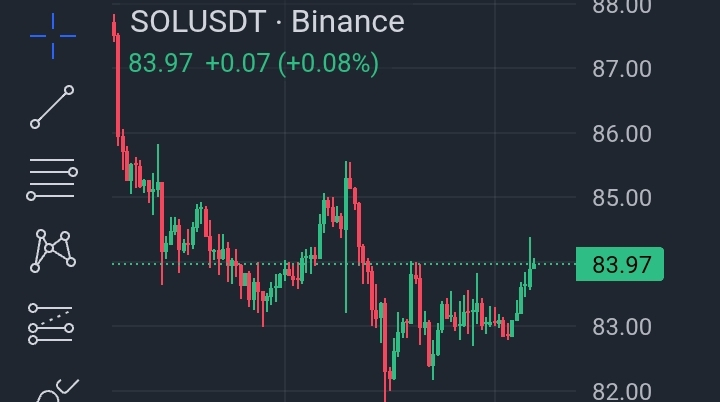
Price Level: The SOL/USDT pair is currently trading at $83.98, reflecting a slight intraday gain of +1.07%.
Recent Trend: The price is consolidating after a significant downward move from late April. It is currently testing an immediate support zone around $83.00, which aligns with a critical 0.382 Fibonacci retracement level.
Key Technical Indicators
The chart features several overlaid indicators that provide insights into volatility and trend strength:
Bollinger Bands (BB):
The price is currently hovering near the middle band (SMA 20), which acts as a pivot point between bullish and bearish short-term momentum.
The narrowing of the bands suggests a "squeeze," indicating that the market is in a phase of energy accumulation and may soon choose a new directional breakout.
Supertrend:
The red line above the price indicates a prevailing bearish sentiment. A reversal to a green line below the price would be a necessary signal for a bullish trend shift.
Moving Averages (SMA):
The price remains significantly below its longer-term averages, such as the 200-day SMA (historically near $125-$130 in this period), confirming that the broader trend is still downward.
Volume:
Recent volume bars show a decrease in selling pressure, which could suggest that the current downtrend is losing steam.
Bull vs. Bear Scenarios for May 2026
Analysts identify specific levels that will likely dictate movement for the rest of the month:
Scenario Key Levels to WatchOutlookBullishBreak above $85.13 and $91.07Could propel price toward $97.64, invalidating the current bearish structure.BearishBreak below $83.01 or $78.03Could trigger a further decline toward the $69.97 neckline or deeper support at $56.
Note: This analysis is based on historical technical data and should not be considered financial advice. Always verify live market data on platforms like TradingView before making trading decisions.#Xrp🔥🔥