
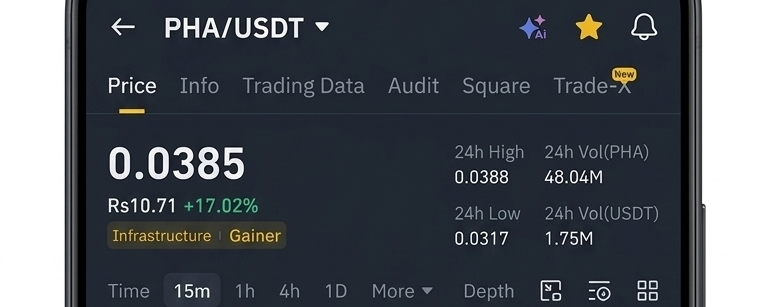
The cryptocurrency market is experiencing notable volatility, and Phala Network ($PHA ) is currently among the top daily performers on Binance, showing a +17.02% increase over the past 24 hours.
Let’s analyze the 15-minute chart to understand the current market structure and identify the key technical levels based on moving averages and momentum indicators.
📊 Technical Structure Overview
1. Exponential Moving Averages (EMA)
The 15-minute chart indicates a structured upward alignment across major moving averages:
EMA(7) [Yellow]: $0.0383
EMA(25) [Pink]: $0.0374
EMA(99) [Purple]: $0.0352
The price is currently sustaining its position above all three key EMAs. The short-term EMA(7) remains above the medium-term EMA(25), suggesting that buyers are maintaining control over the immediate trend. Recent pullbacks have found consistent stability near the EMA(25) zone.
2. Relative Strength Index (RSI-6)
Current Value: 67.55
Analysis: The RSI is currently positioned just below the 70 line. This indicates steady upward momentum without entering the extreme overbought territory, suggesting the current trend remains technically stable.
3. Volume Observations
Following the initial volume spike, trading activity has stabilized. The volume on green candles remains consistent compared to red retracement candles, pointing to steady market participation at these levels.
🗝️ Technical Levels to Monitor
Key Resistance Zone ($0.0388): This represents the local high. A clean breakout and stabilization above this level generally indicate a continuation of the upward structure.
Immediate Support Zone ($0.0374): Coinciding with the EMA(25), this serves as the primary floor for the current short-term trend.
Major Support Zone ($0.0352): Guarded by the EMA(99), this is the macro baseline for the asset on this timeframe.
#CryptoTrading #TechnicalAnalysis #PhalaNetwork #BinanceSquare #WriteToEarn
