

Seven consecutive days of Bitcoin ETF outflows have wiped $1.59B from cumulative inflows as price breaks below all major moving averages on the 4H chart.
Key Takeaways:
Seven straight days of Bitcoin spot ETF outflows totaling $1.59B
May 18 single-day outflow of $648M was the largest in the streak
Price dropped to $75,300 before recovering slightly to $75,509
RSI at 37 on 4H chart, momentum firmly bearish, signal line at 48.73
$74,255 is the critical support, break opens CME gap near $67,000
Bitcoin dropped to $75,300 this morning before recovering slightly to $75,600 at the time of writing, down 1.8% on the day, and the move lower has a clear institutional fingerprint on it. Seven consecutive sessions of spot Bitcoin ETF outflows have now pushed cumulative net inflows down from $58.34B on May 15 to $56.75B on May 26, removing $1.59B from the cumulative position in less than two weeks. Total net assets across all spot Bitcoin ETFs dropped from $104.29B to $98.40B in the same period, falling back below the $100B mark in the process.
This isn't a single bad day being read as a trend. Seven sessions in a row with no interruption is a sustained institutional move, not noise.
What the ETF data actually shows
According to Sososvalue data, the outflow streak started May 15 with $290M leaving. May 18 saw the largest single-day outflow at $648M, the heaviest selling day in the streak by a significant margin. May 19 added $331M, May 20 slowed to $70M, May 21 and May 22 held in the $100-105M range suggesting the heavy selling had moderated, and then May 26 came in at $333M, nearly matching the May 19 level and confirming the pressure hadn't resolved.
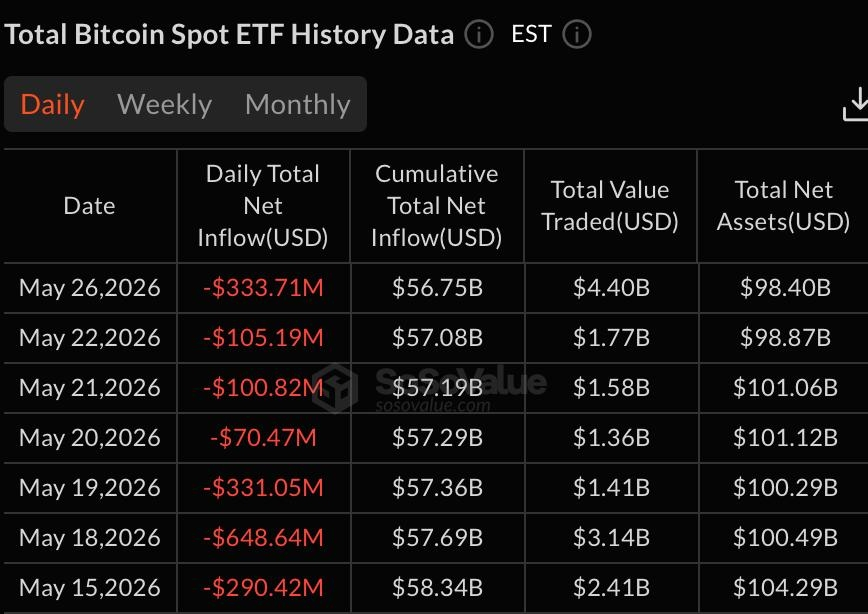
The pattern inside the streak matters. The $648M May 18 spike followed by a moderation to $70-105M and then a re-acceleration to $333M on May 26 suggests this isn't a single decision being unwound gradually. It looks more like waves of selling from different institutional participants responding to the same macro conditions at different speeds.
The macro backdrop driving the outflows is a combination of stronger-than-expected inflation data reducing rate cut expectations and continued geopolitical pressure from Iran-US tensions keeping risk appetite suppressed. Institutional investors who entered Bitcoin ETFs as a risk-on trade are reducing exposure in a risk-off environment, the same dynamic that drove $1.47B in weekly outflows in the CoinShares report covering the period through May 22.
What the 4H chart is showing
The price action on the 4H chart confirms the ETF data. Bitcoin has broken below all three moving averages, SMA50 at $76,806, SMA100 at $78,188, and SMA200 at $78,469, and all three are declining and converging tightly in a $1,600 range between $76,800 and $78,500. That cluster of three declining SMAs sitting above current price is a meaningful resistance ceiling. Getting back above any one of them requires pushing through all three in close succession.
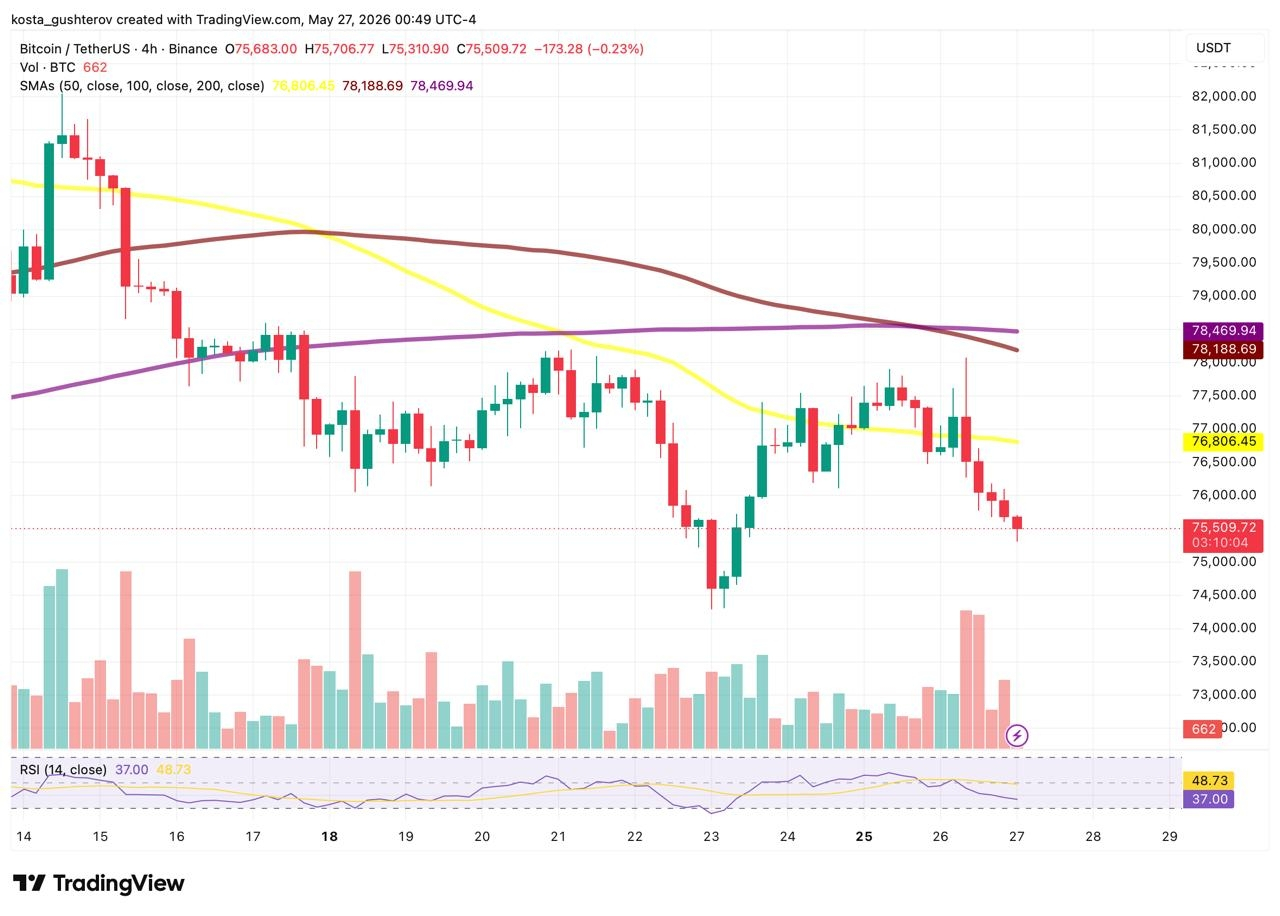
RSI at 37.00 on the 4H is approaching oversold territory but hasn't reached it. The signal line sits at 48.73, with RSI more than 11 points below its signal, confirming momentum is firmly bearish rather than just pausing. When RSI is this far below its signal line on a 4H chart, bounces tend to be short-lived until RSI either reaches genuine oversold levels around 30 or the signal line catches down to meet it.
Volume on the most recent candles toward the right side of the chart has picked up on the red sessions. Selling is accelerating rather than tapering off, and that's the detail that makes the current move more concerning than a simple pullback from an overbought level.
The levels that matter from here
Two price points define the near-term setup.
$74,255 is the recent swing low and the immediate support below current price. If buyers step in at that level the most likely near-term path is a grind back toward the $76,800-$78,500 resistance cluster, a recovery that would face the three declining SMAs as a ceiling. That would keep Bitcoin in a defined range while institutional flows either stabilize or reverse.
If $74,255 breaks on a meaningful close, the picture changes significantly. The CME gap near $67,000 becomes the next relevant reference point below. CME gaps, price levels where Bitcoin futures traded but the spot market didn't overlap, have a historical tendency to get filled eventually. A weekly close below $75,000-$76,000 would confirm bearish momentum is carrying rather than fading, and $67,000 comes into scope as a target rather than a distant possibility.
The 30-day accumulator cost basis sits near $76,500. Bitcoin is currently trading below that level, meaning short-term accumulators who bought over the past month are underwater on average. That creates additional selling pressure from holders who bought the recent range and are now looking at losses, not the kind of holders who tend to sit through extended drawdowns.
What to watch today
The US trading session on May 27 carries two specific things worth watching. First, the daily ETF flow data. If today breaks the seven-day outflow streak, even with a small inflow, that would be the first signal that institutional selling pressure is fading. A large inflow would be a more meaningful signal. A continuation of outflows at May 26 levels would confirm the trend is still running.
Second, any developments on the Iran-US situation. The geopolitical risk suppressing risk appetite across markets hasn't resolved. A de-escalation signal, ceasefire news, diplomatic progress, anything that reduces the probability of broader conflict, would likely trigger a risk-on response across crypto alongside equities.
Until one of those two things changes, the path of least resistance on the chart points toward $74,255. How that level holds, and what the ETF data looks like when it gets there, will answer the question of whether this is a correction with a floor or the beginning of a move toward $67,000. #BTC