$ESIM Chart Analysis
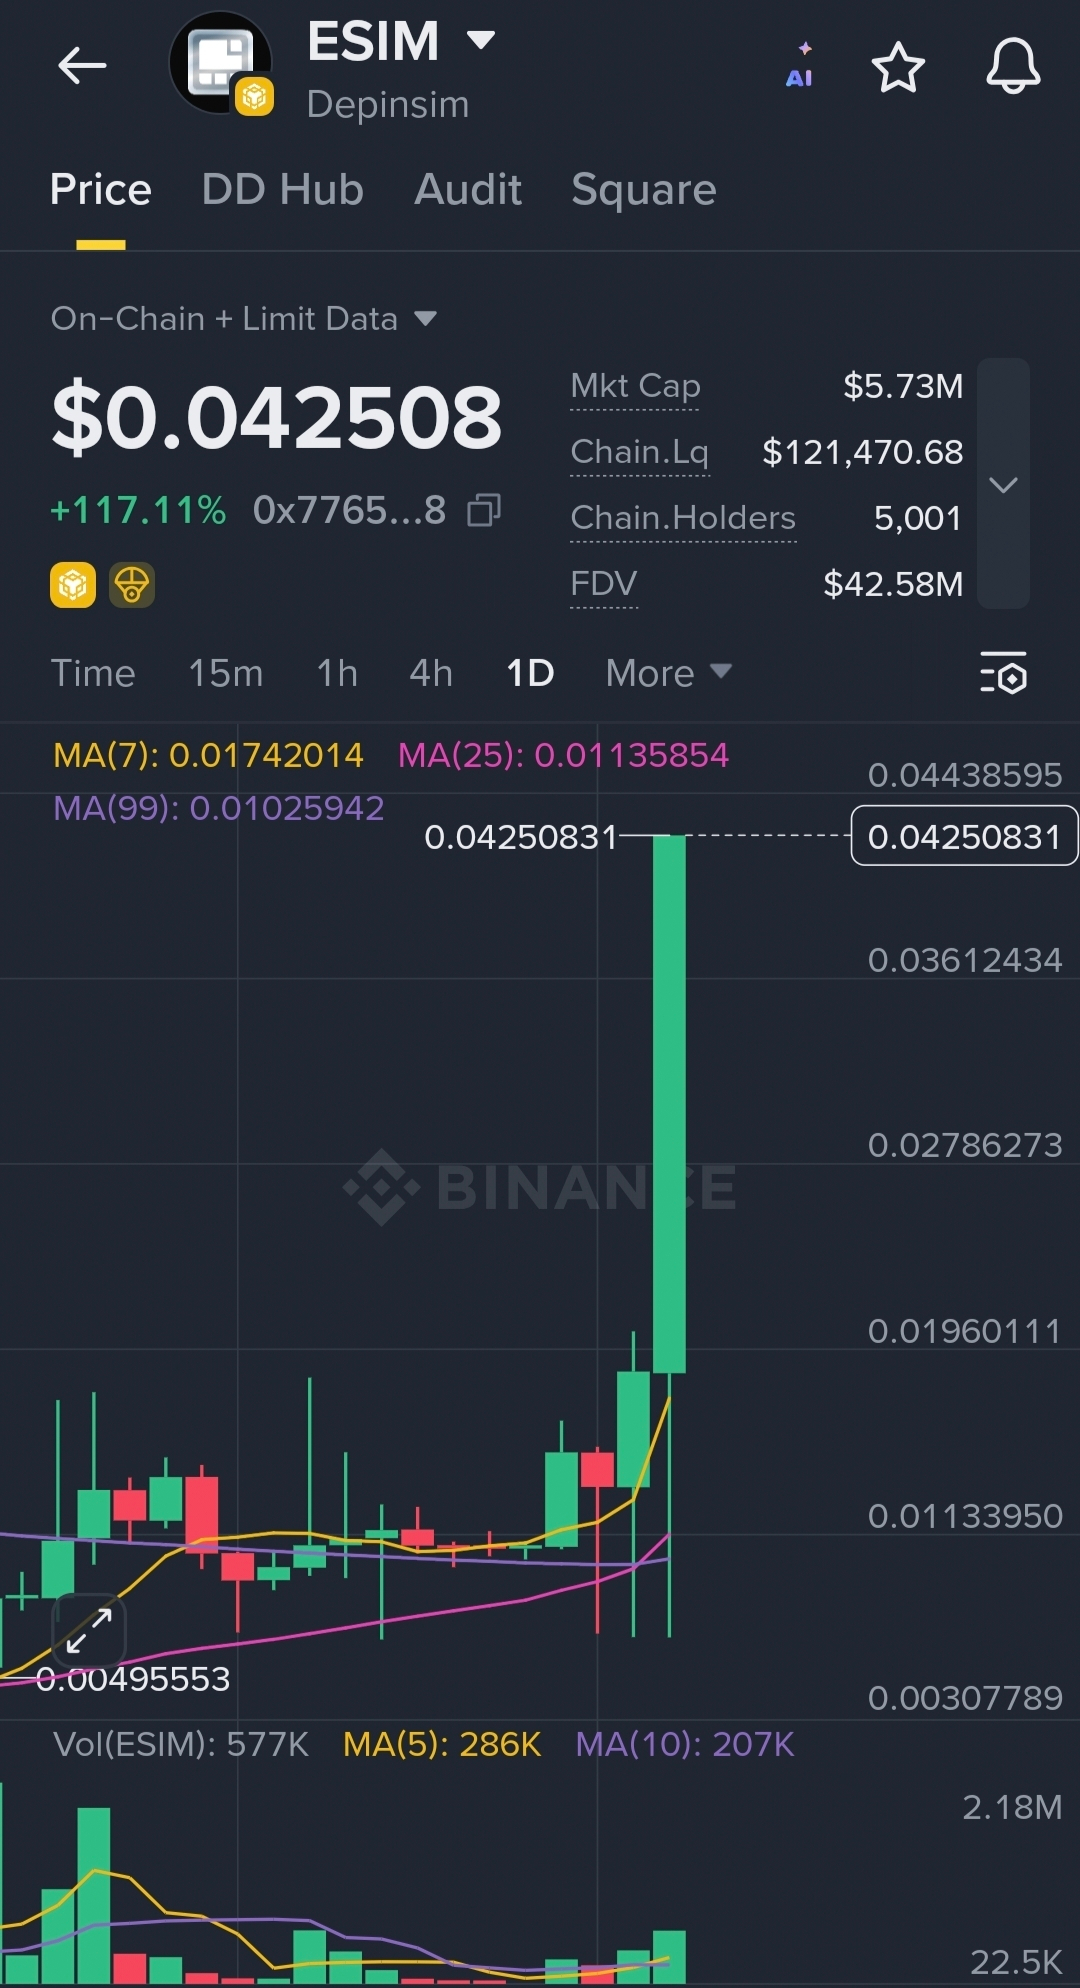
Current Price: 0.0425
Daily Gain: +117%
Market Cap: $5.73M
Holders: 5,001
Liquidity: $121K
This chart shows an extremely aggressive bullish breakout candle after a long consolidation period.
Technical Structure Analysis
1. Accumulation Phase
Before the breakout:
Price moved sideways for many candles
Small candle bodies formed
Low volatility appeared
MA lines compressed tightly
This type of structure usually means:
Smart money accumulation is happening quietly.
The base zone formed around:
0.009 – 0.012
That became the launchpad for the breakout.
2. Breakout Explosion
The latest candle is: ✅ Very large bullish candle
✅ Strong volume expansion
✅ Full MA breakout
✅ Momentum acceleration
This is called:
“Vertical Expansion Move”
It indicates:
Buyers are dominating
FOMO may begin
Shorts/liquidity getting trapped
Moving Average Analysis
The chart shows:
MA(7) above MA(25)
Price far above all MAs
Strong momentum separation
This is highly bullish short-term.
But: ⚠️ Price is now extended far from averages
⚠️ Pullback probability increases after huge pumps
Volume Analysis
Volume increased sharply during the breakout.
That confirms:
Real participation
Strong buyer interest
Momentum continuation possibility
Without volume, pumps fail quickly.
Here: ✅ Volume supports the move.
Key Resistance Levels
Immediate Resistance
0.044 – 0.050
Psychological breakout zone
Major Resistance
0.060 – 0.075
Possible next FOMO target
Extreme Bullish Scenario
If hype continues:
Possible spike toward 0.10+
But this would require:
Viral momentum
Social media hype
Strong liquidity inflow
Key Support Levels
First Support
0.028 – 0.030
Strong Support
0.018 – 0.020
Critical Support
0.011
Breakdown below this weakens bullish structure.
Risk Analysis
This candle is very powerful… but also dangerous.
Why? Because vertical pumps often create:
Profit booking
Whale dumps
Fake breakouts
After 100%+ candles:
Volatility becomes extreme
Retracement can happen anytime
Market Psychology
This chart currently reflects: ✅ Strong hype
✅ Momentum chasing
✅ Aggressive buying pressure
✅ FOMO entry behavior
Retail traders usually enter late during candles like this.
Smart traders wait for:
Retest
Consolidation
Volume confirmation
Bullish Scenario
If price:
Holds above 0.030
Consolidates properly
Keeps volume high
Then continuation toward:
0.05
0.06
0.08
becomes possible.
Bearish Scenario
If this becomes exhaustion:
Sharp correction can occur
Fast drop toward MA zones possible
Weak holders may panic sell
Final Verdict
Overall Structure:
🔥 Extremely Bullish Short-Term
Momentum:
🚀 Explosive breakout confirmed
Risk:
⚠️ Very High Volatility
Best Observation:
The breakout is real because:
Volume increased
MA breakout confirmed
Candle strength is strong
But traders should watch carefully for:
Profit-taking
Fake continuation
Sudden liquidity drops
#Binance #Write2Earn #CZ #TrendingTopic #bnb