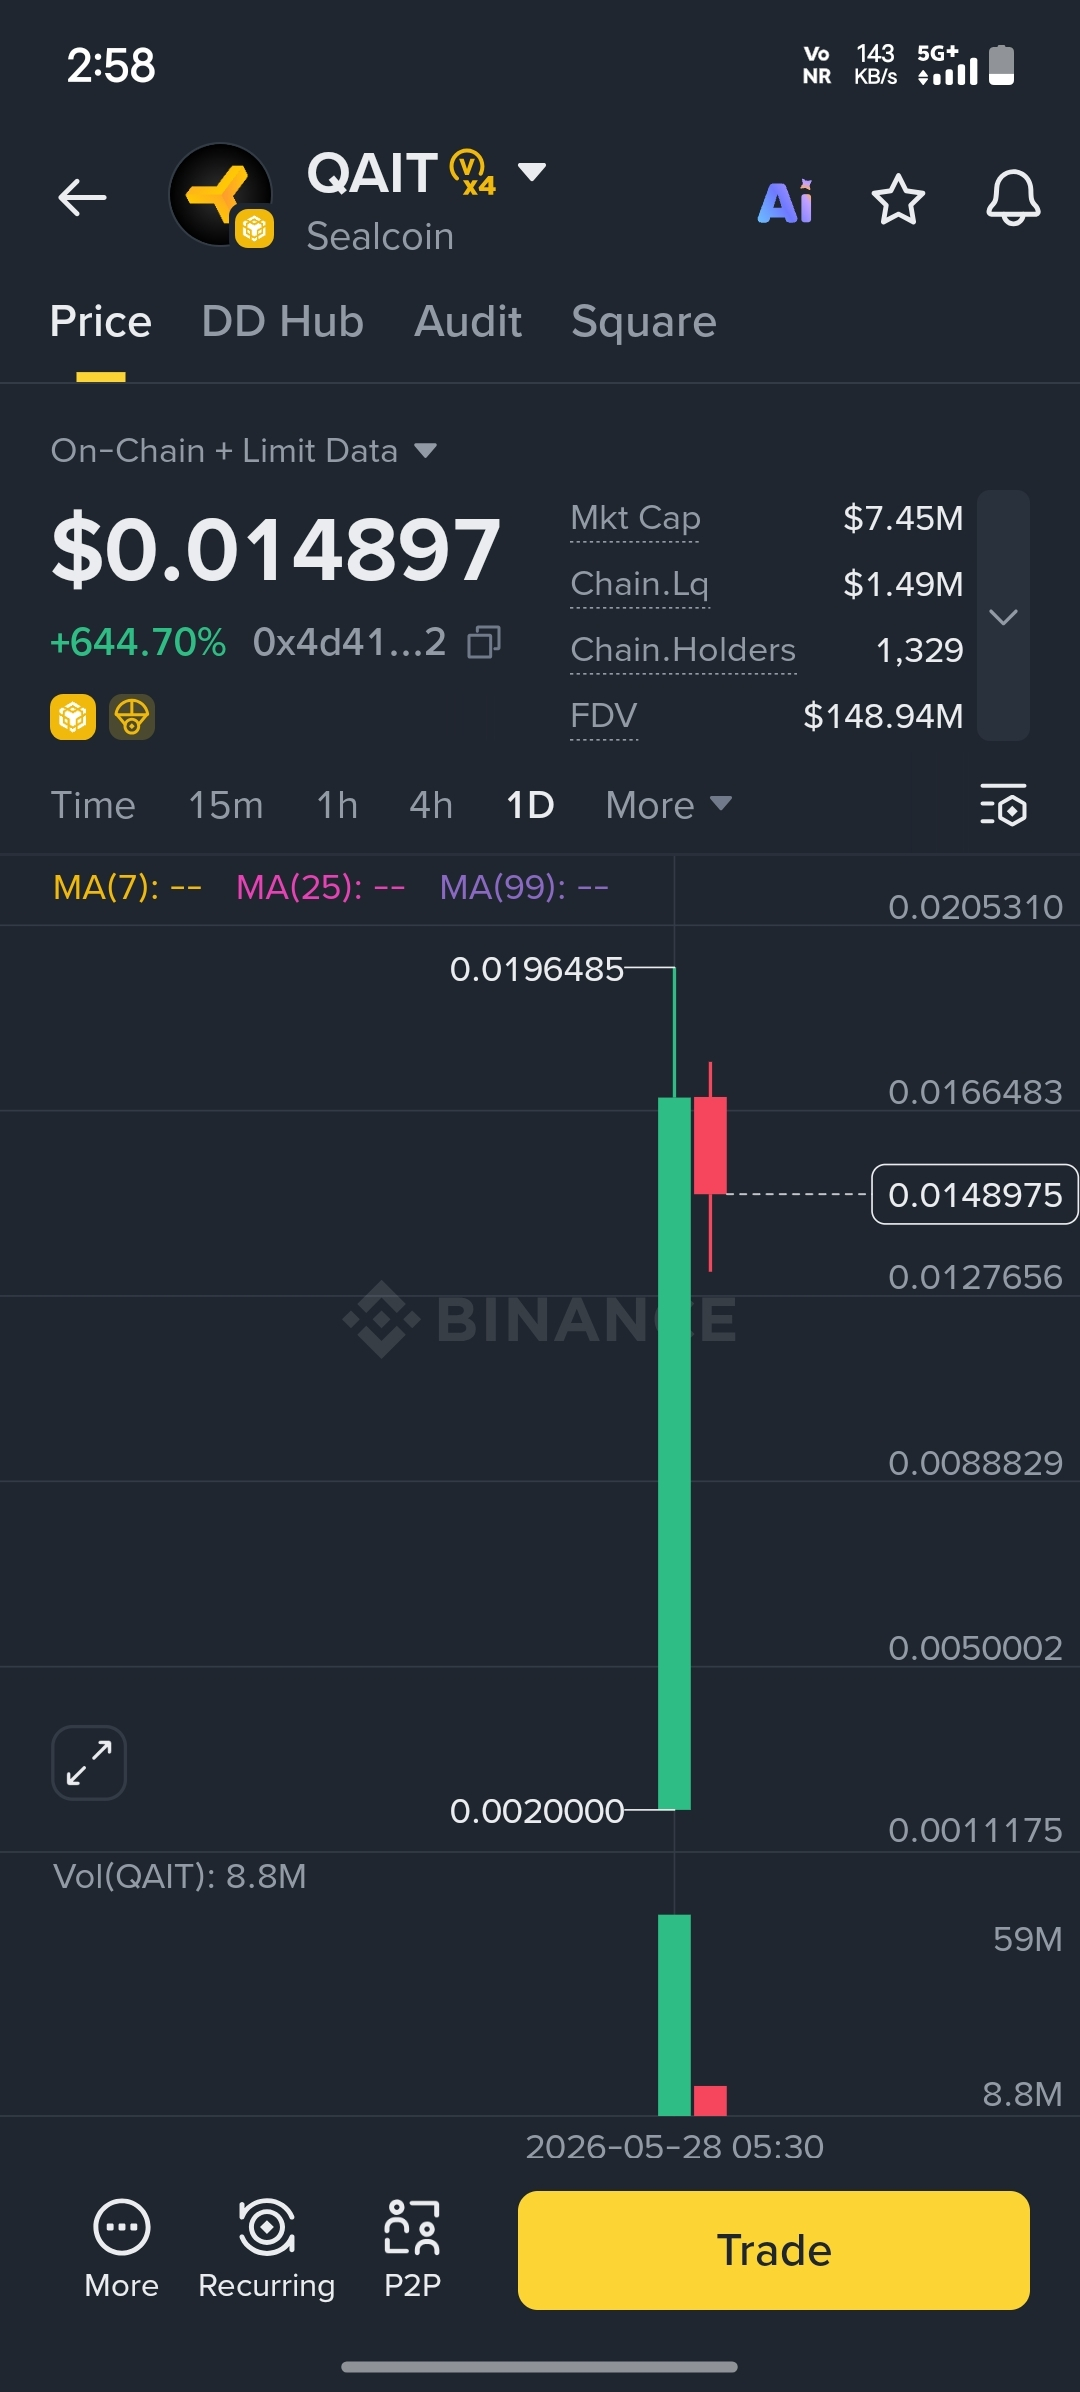
$QAIT Chart Analysis (1D)
Current Price: ~$0.0149
24H Move: +644% massive pump
Market Cap: ~$7.45M
Liquidity: ~$1.49M
Technical View
Chart shows an explosive breakout candle from around 0.0020 → 0.0196.
After huge buying pressure, a red correction candle appeared near resistance.
This usually means:
Early buyers are taking profit.
Market is testing whether momentum is strong enough for another leg up.
Important Levels
Resistance Zone:
0.0165 → 0.0196
If price breaks above this area with volume, another pump can happen.
Support Zone:
0.0127 → 0.0100
Holding this area keeps bullish structure safe.
Volume Analysis
Very high volume confirms strong hype and fresh liquidity.
But such parabolic moves are also high-risk because volatility becomes extreme.
Bullish Scenario
If buyers defend support and volume returns:
Possible targets:
0.018
0.020+
New all-time highs
Bearish Scenario
If support breaks:
Fast retracement toward 0.010 or lower possible.
Meme/small-cap coins often dump hard after vertical pumps.
Short Note
QAIT currently looks like a high-momentum speculative coin. Trend is bullish short-term, but after a 600%+ move, traders should watch for heavy volatility and profit-booking candles before entering new positions.
#binance #TrendingTopic #CZ #Write2Earn #btc