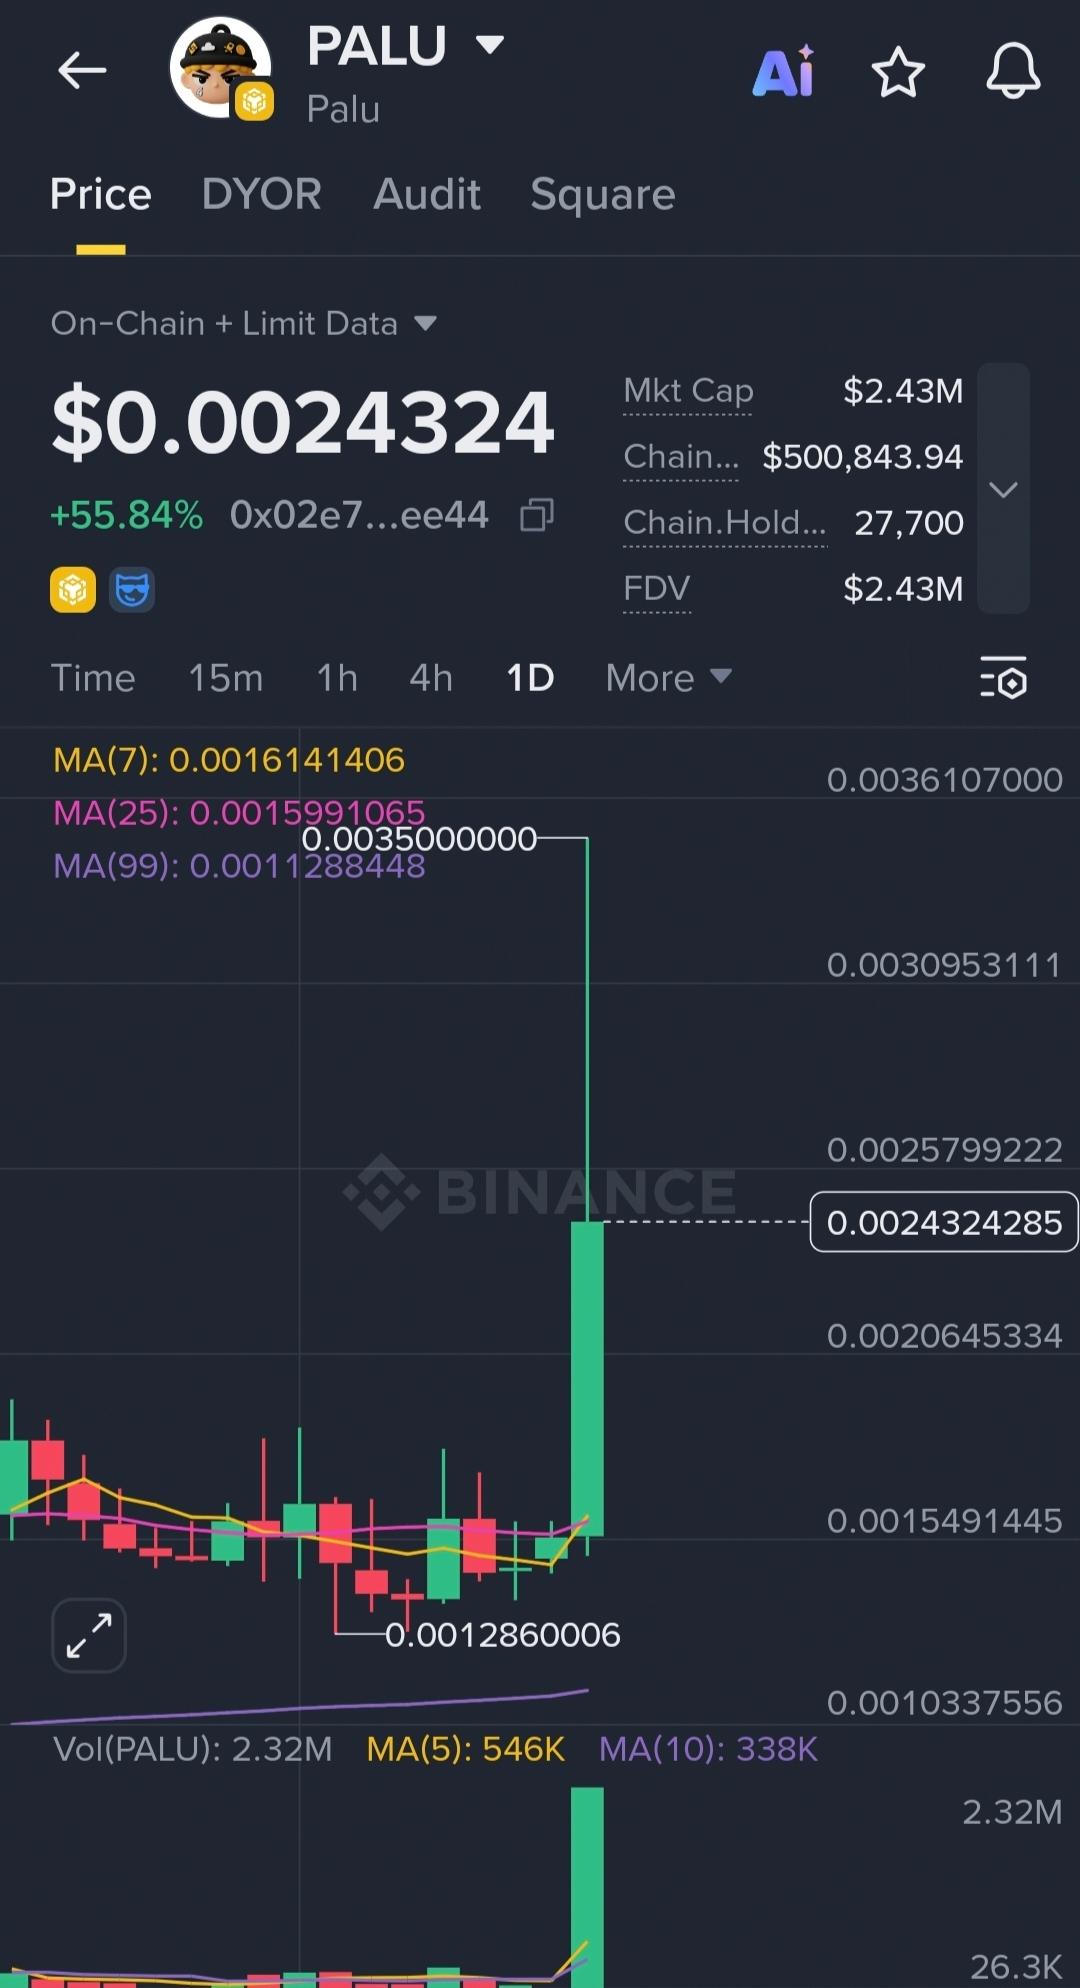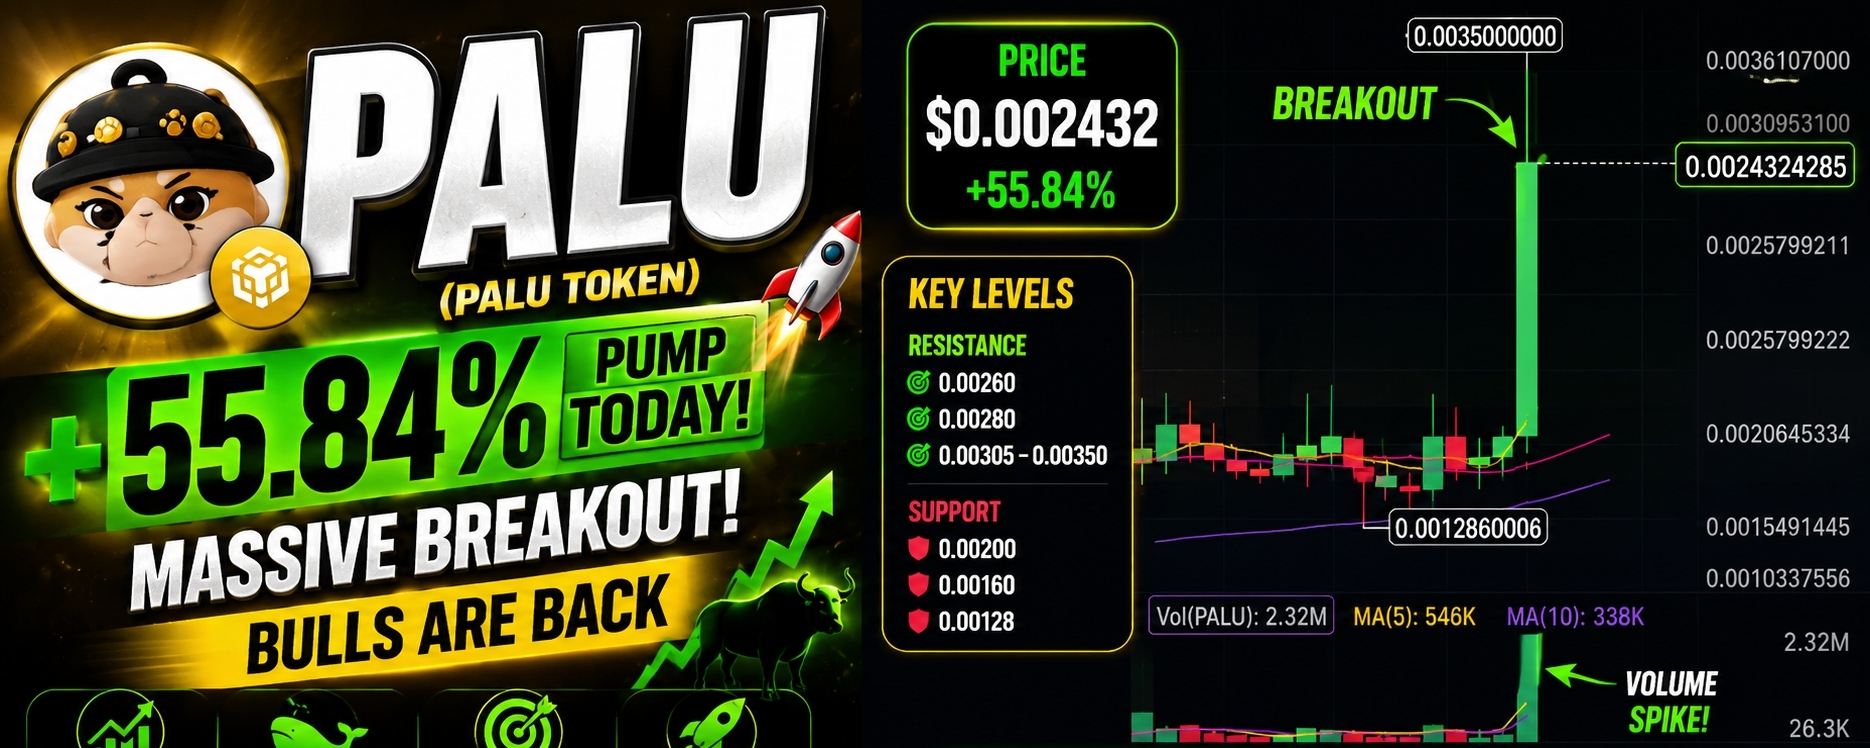
Current Price: $0.002432 (+55.84%)
📈 Technical Overview
PALU has produced a massive bullish breakout candle on the daily chart. The current candle is significantly larger than previous candles and is supported by a sharp increase in trading volume, indicating strong buyer participation.
Bullish Signals
✅ Price is trading above MA(7), MA(25), and MA(99)
✅ Daily gain of over 55% shows strong momentum.
✅ Volume spike confirms that the breakout is backed by real buying interest.
✅ Higher low formed near $0.00128, indicating accumulation before the breakout.
Key Levels
Resistance Zones
$0.00260 – $0.00280 (short-term resistance)
$0.00305 – $0.00350 (major resistance zone and recent high)
Support Zones
$0.00200
$0.00160 (MA support area)
$0.00128 (strong structural support)
Volume Analysis
The volume bar is many times larger than recent sessions. Such volume expansion often signals:
Start of a new uptrend
Whale accumulation
Breakout from consolidation
However, after a 55% move, some profit booking is also possible.
Possible Scenarios
Bullish Scenario 🚀
Hold above $0.00220
Break above $0.00280
Target: $0.00310 → $0.00350
Bearish Scenario ⚠️
Failure to hold $0.00200
Pullback toward $0.00160–$0.00180 zone
Healthy correction before the next move
Conclusion
PALU currently looks strongly bullish on the daily timeframe. The breakout is supported by volume and moving averages, which increases the probability of further upside. Traders should watch the $0.00280 resistance area closely. A clean breakout above it could trigger another strong rally toward $0.00350.
#Binance #btc #TrendingTopic #CZ #Write2Earn