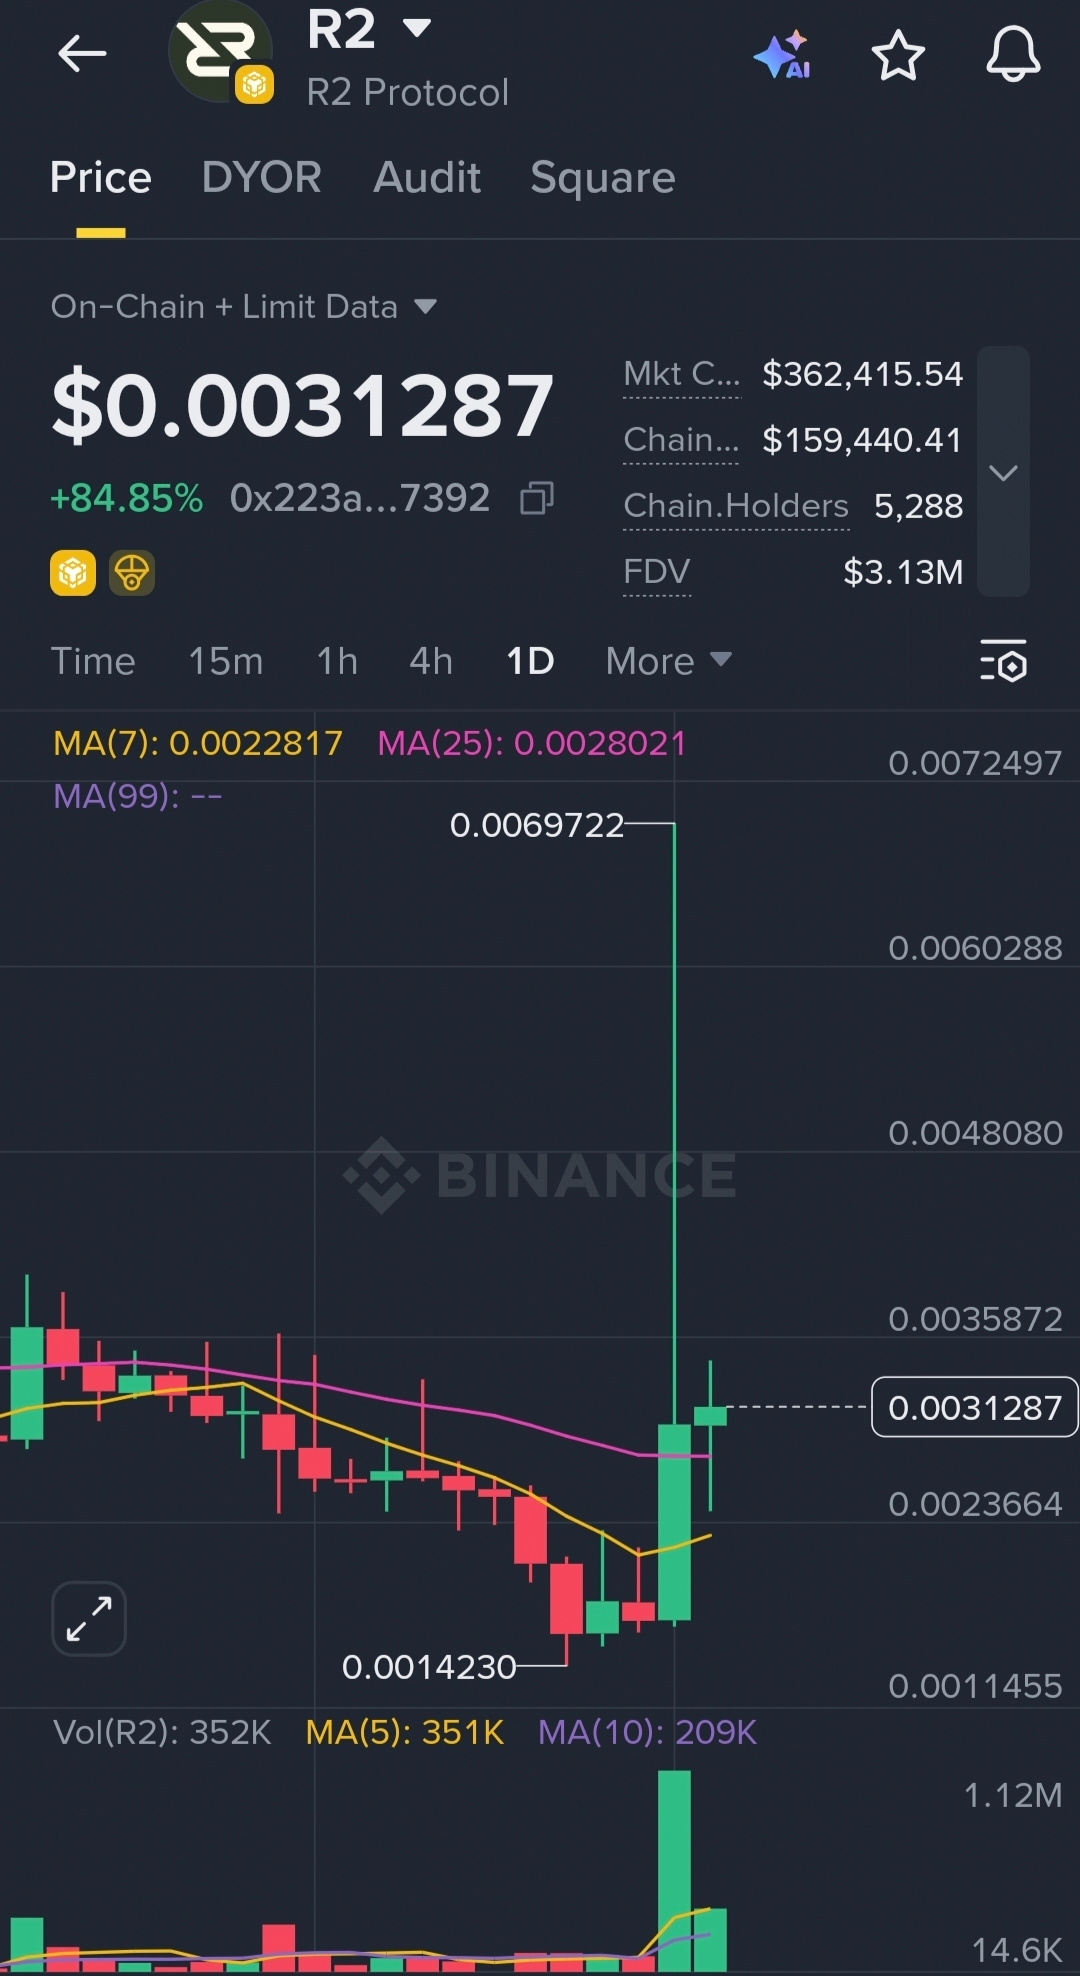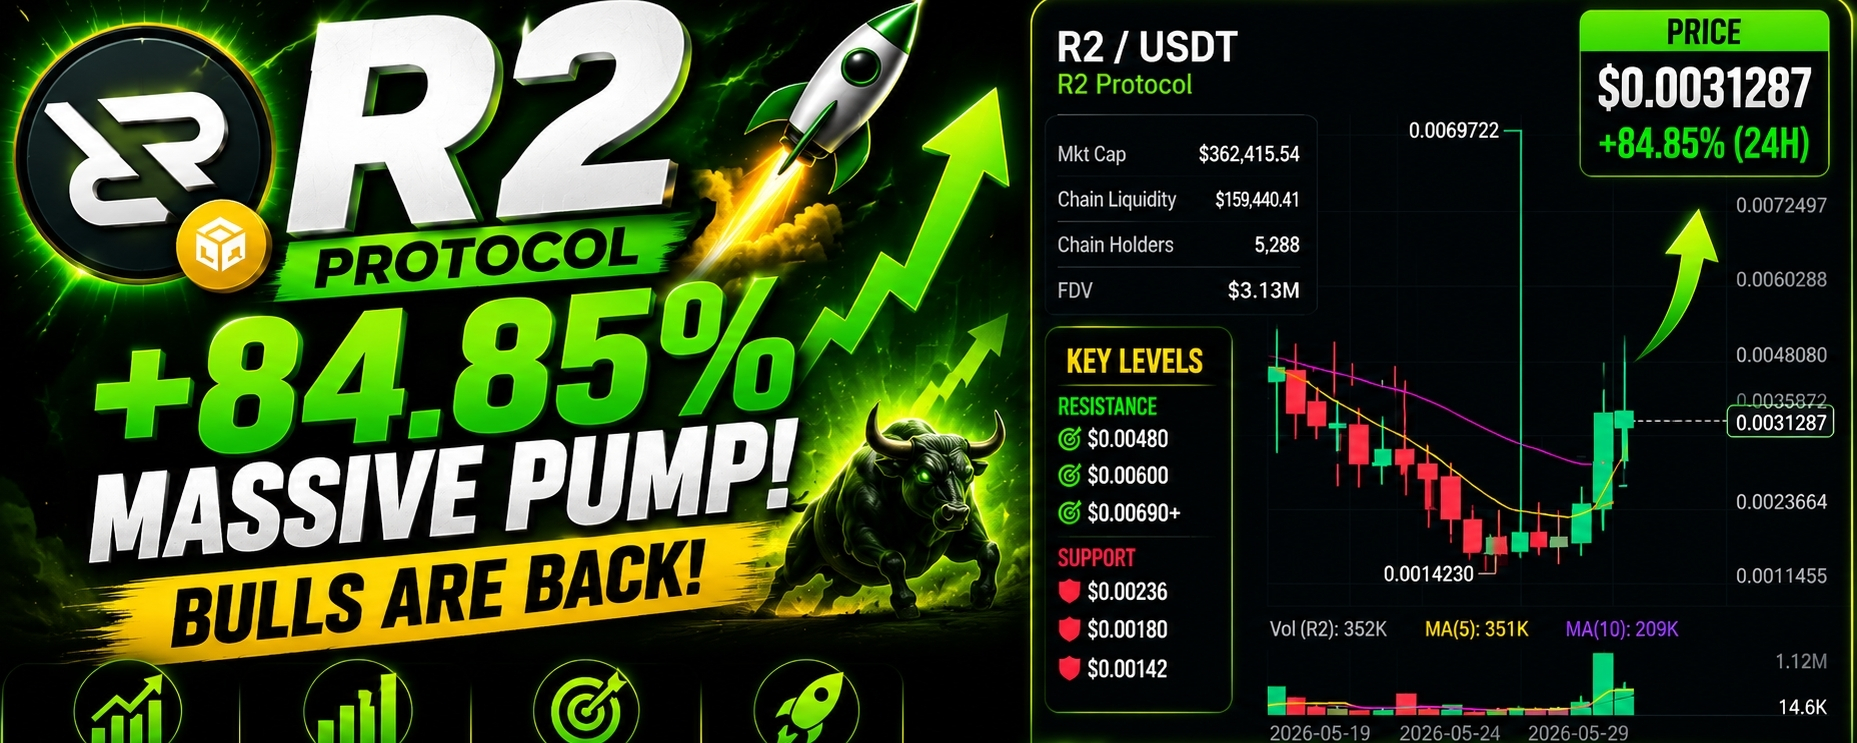
Current Price: $0.0031287
24H Change: +84.85%
📈 Market Structure
R2 has printed a very strong bullish reversal candle after a prolonged downtrend. The chart shows a clear recovery from the low around $0.00142, followed by an explosive move with heavy volume.
The large green candle and volume spike suggest fresh buying interest entering the market.
🔥 Bullish Signals
✅ +84.85% daily gain
✅ Massive volume expansion (highest volume on the chart)
✅ Price reclaimed MA(7) and MA(25)
✅ Strong rejection from the bottom near $0.00142
✅ Buyers successfully defended support and triggered a breakout
📊 Key Resistance Levels
Resistance 1
$0.00360
Immediate resistance zone.
Resistance 2
$0.00480
Major breakout level.
Resistance 3
$0.00697
Recent spike high.
Strong profit-taking zone.
🛡️ Support Levels
Support 1
$0.00280
Short-term support.
Support 2
$0.00220
Moving average support.
Support 3
$0.00142
Strong historical bottom.
📉 Volume Analysis
The volume bar is dramatically larger than previous sessions.
This often indicates:
Whale accumulation
New money entering
Trend reversal
Breakout confirmation
However, after an 80%+ move, short-term profit booking is normal.
🎯 Possible Targets
Bullish Scenario 🚀
If R2 stays above $0.0028:
Target 1 → $0.0036
Target 2 → $0.0048
Target 3 → $0.0069
Bearish Scenario ⚠️
If buyers lose momentum:
Pullback zone → $0.0022–$0.0028
This would still be healthy consolidation after a large rally.
Overall Verdict
Trend: Bullish
The chart currently shows one of the strongest reversal patterns seen after a downtrend. Volume, price action, and moving averages all favor the bulls. As long as price remains above $0.0028, momentum remains positive
#Binance #CZ #TrendingTopic #Write2Earn #Write2Earn!