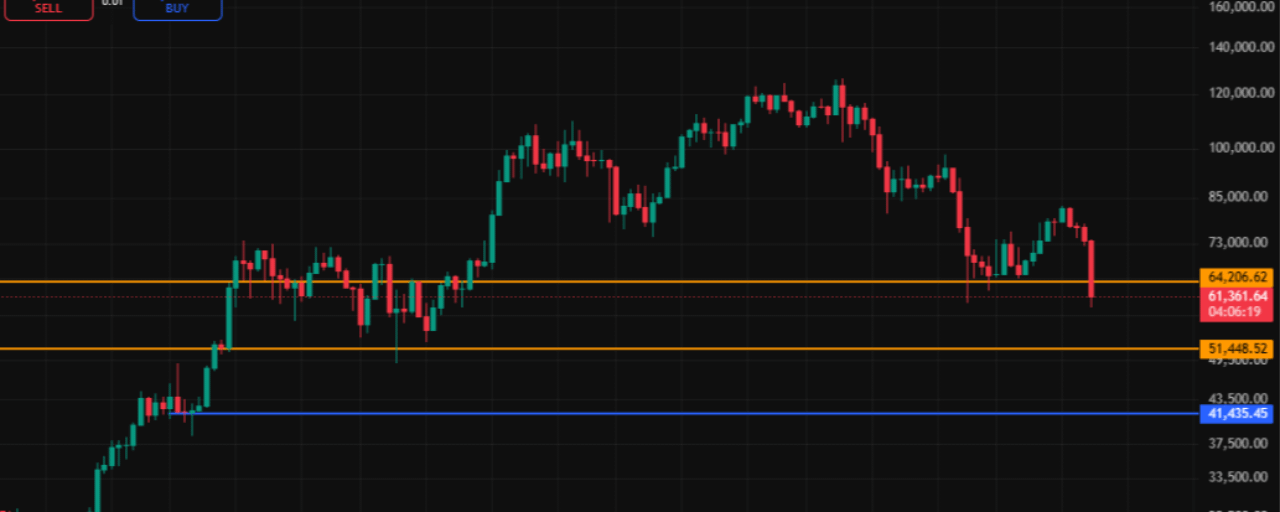
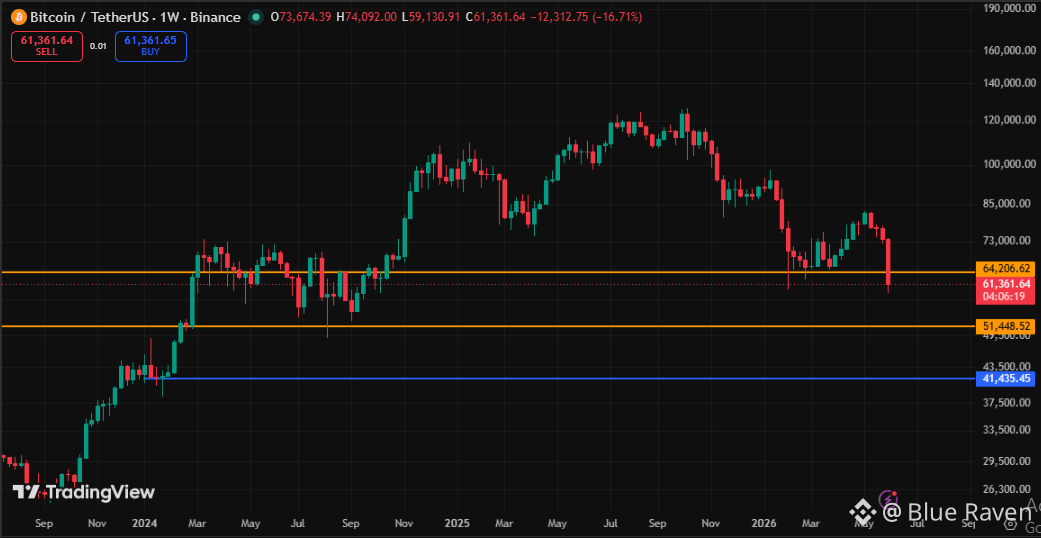
$BTC was holding the 64.2K resistance zone. But now it has broke the zone and also showing heavy bearish momentum if you look at the chart.
$BTC is dumping to 50K this week. If Bitcoin also breaks the 50K resistance zone it'll again dump to 45-42K.
If you see at the USDT.D chart, you'll understand where I'm getting the confidence from. In this chart you can see that the USDT dominance is very much bullish this week. It is also indicating a bullish continuation. Hope you'll all know USDT.D has negative co-relation with Bitcoin.
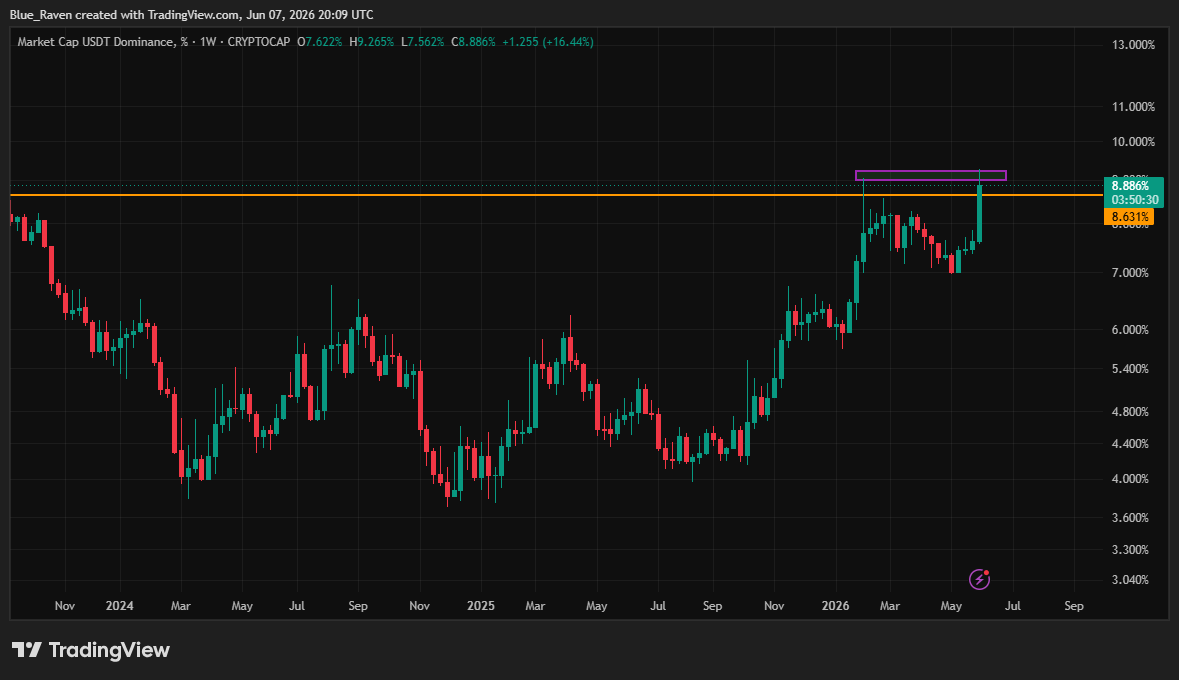
Click below to check the chart 👇

BTCUSDT
Perp
61,305.4
-3.98%