
When $BTC plunged toward $59,000, panic spread across the market.
Bears celebrated.
Weak hands sold.
Short sellers piled in.
It looked like the breakdown everyone had been waiting for.
But then something unexpected happened... 👀
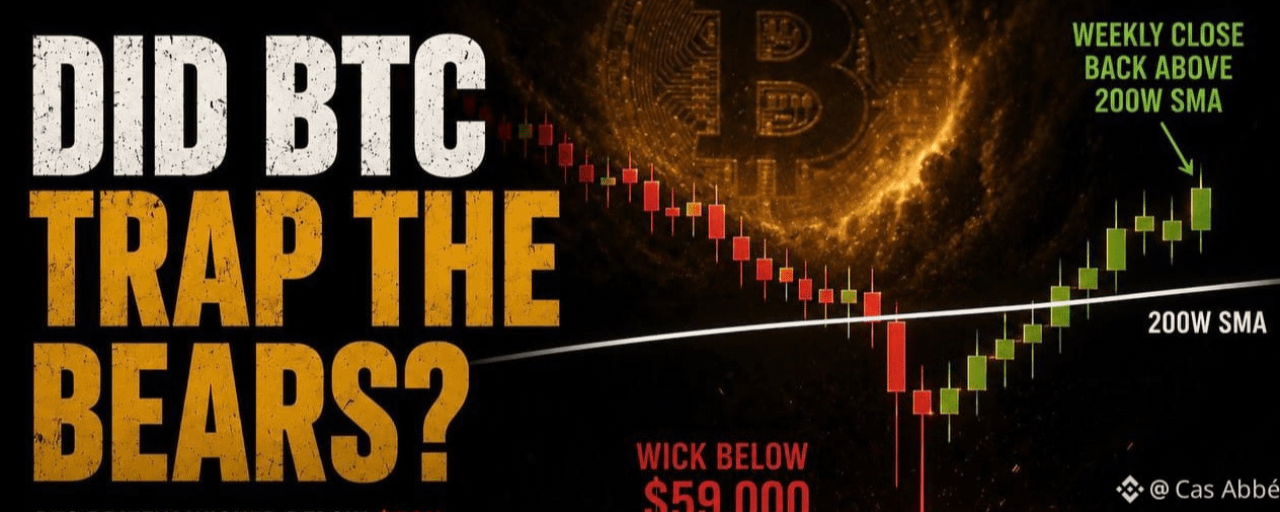
Bitcoin reclaimed its 200-week Simple Moving Average before the weekly close — a level that has historically marked the end of every major bear market.
Think about it:
🔹 2015: BTC bottomed near $200 and exploded higher after reclaiming the 200W SMA.
🔹 2018: An 84% crash ended near $3,000, right around the same indicator.
🔹 2020: The COVID panic briefly pushed BTC below it before one of the strongest bull runs in history.
🔹 2022: The FTX collapse couldn't keep Bitcoin below it for long.
Every time fear peaked, this level became the battlefield where bears lost control.
Now fast forward to today.
Bitcoin sliced below February's $60K low, triggering stop losses and convincing traders that a deeper crash had begun.
The move looked devastating.
Yet within days, buyers stepped in aggressively and pushed BTC back above one of the most important trend indicators in crypto history.
That's what makes this move so dangerous for bears.
The market gave them confirmation...
Then took it away.
Meanwhile, the 200-week SMA itself has climbed above $60,000, suggesting Bitcoin's long-term structural floor is much higher than in previous cycles.
If history rhymes, the recent drop may not have been the beginning of a bear market.
It may have been the final shakeout before the next major move higher.
The question is:
Was the dip below $59K a genuine breakdown...
Or a perfectly engineered trap that convinced thousands of traders to sell the bottom? 🤯📈
#Bitcoin #BTC #Crypto #BullRun #BearTrap #BitcoinAnalysis #CryptoMarket #BTCUpdate