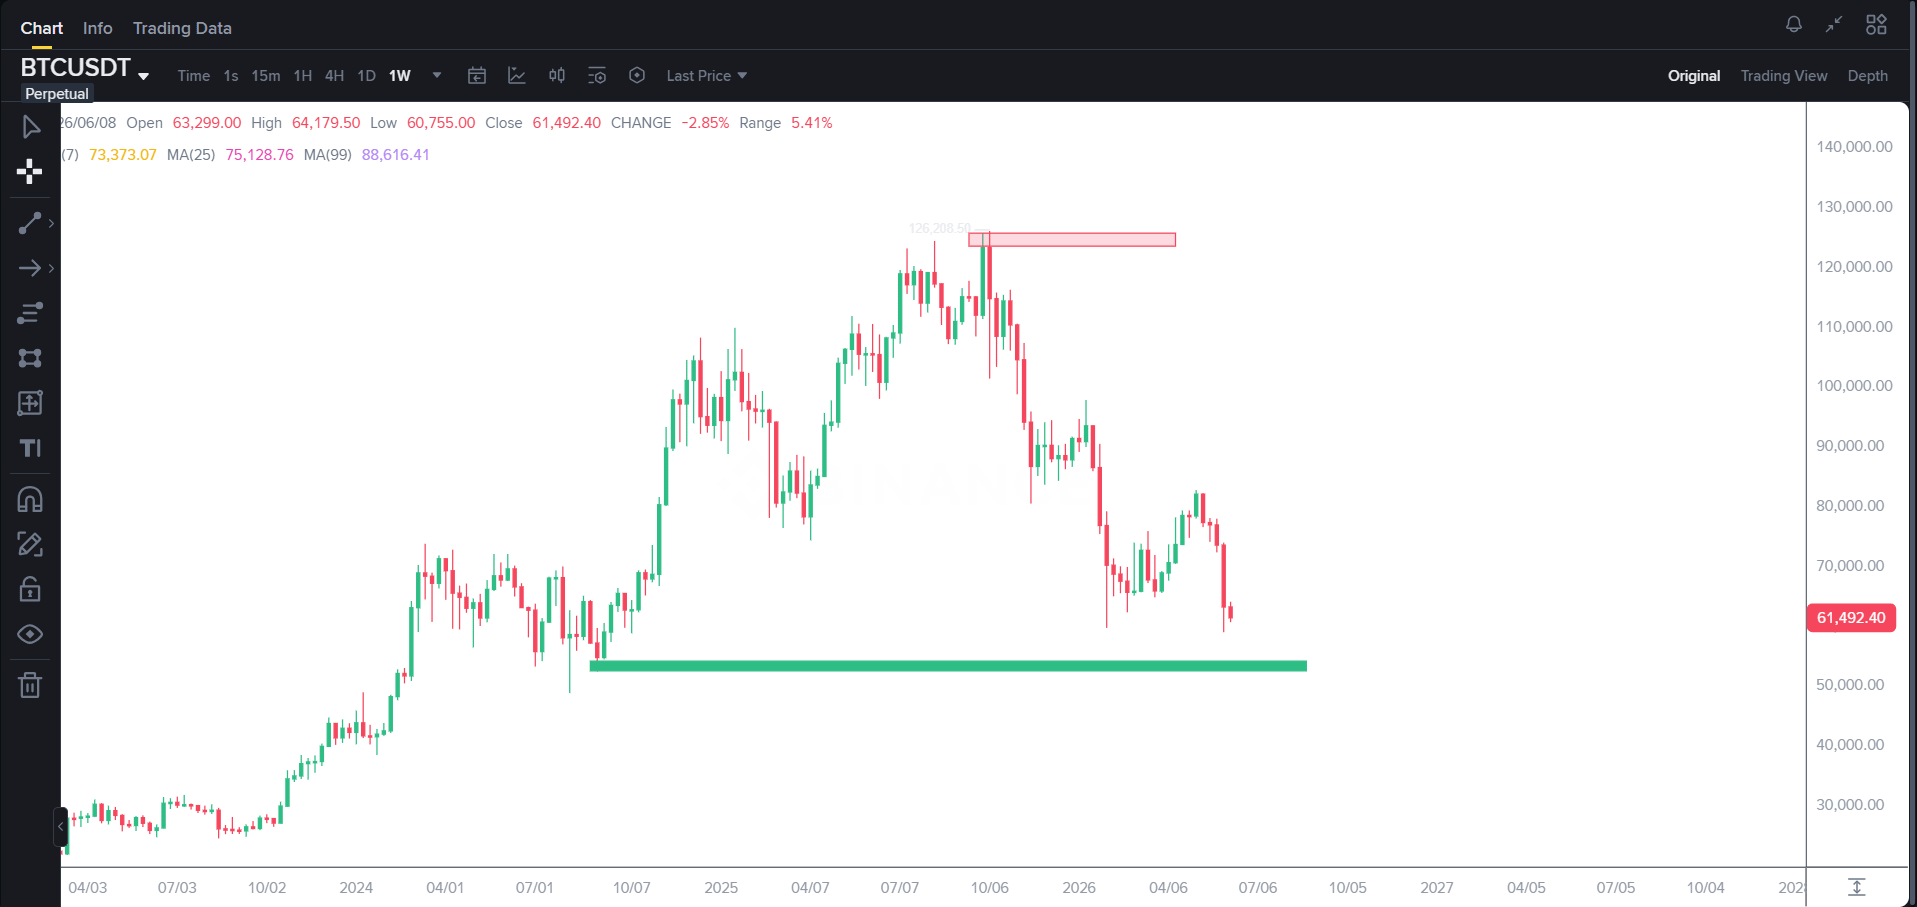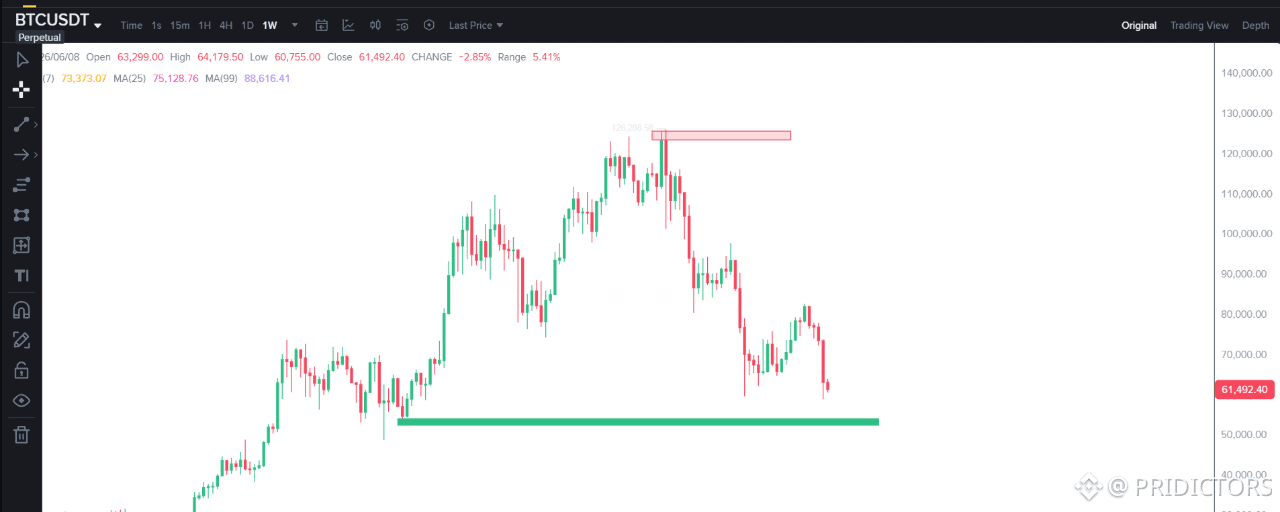
On the weekly $BTC chart, sellers currently have the upper hand. Price has broken down from the previous consolidation area and is trading below the major support zone around 71k.
Current Market Structure
The larger trend from 2023 into 2025 was strongly bullish. After making a new all-time high near the 120k-125k region, $BTC formed a distribution top.
Since then, the chart has produced:
Lower highs.
Strong bearish impulse candles.
Failure to reclaim previous support.
A breakdown below the green dashed area around 71k.
At the moment, the market is in a weekly correction phase, and buyers have not yet shown convincing strength.
Important Levels I Was Looking
Resistance Zones
🔴 120k-125k
Major supply zone.
Previous distribution area.
🔴 70k-72k
Previous support is Now acting as resistance after the breakdown.
Support Zones
🟢 52k-55k
Strong weekly demand zone.
Visible high-volume support.
🟢 25k-28k
Long-term support from the previous accumulation phase.
Liquidity Areas
Sell-side liquidity exists below the recent lows. Large demand appears around 52k-55k.
If buyers fail there, deeper downside becomes possible.
Invalidation Zone
For bears, a strong weekly recovery back above 71k-72k would weaken the bearish outlook.
Most Probable Scenario
Bitcoin has already lost an important support area around 71k. After such breaks, price often,
Breaks support.
Retests it from below.
Gets rejected.
Continues lower toward the next demand zone.
Because of this structure, the most probable path is Retest of 70k-72k → rejection → move toward 52k-55k support.
If Yoy Are Saying Why?
Break of structure.
Previous support turning into resistance.
Strong bearish momentum.
Lower highs on the weekly timeframe.
Distribution visible near ATH.
Bullish Scenario
For buyers to regain control, Bitcoin needs:
✅ Reclaim 70k-72k
✅ Close weekly candles above that area
✅ Turn former resistance back into support
If that happens, price could revisit
80k
90k
100k
Without reclaiming 71k, bullish continuation is weak.
Bearish Scenario
If Bitcoin continues failing below the broken support
First downside target
🎯 55k
Second downside target
🎯 52k
A breakdown below that demand zone would expose:
🎯 45k-48k
and potentially even lower.
Conservative Short Setup Entry Zone
68k-72k
(Prefer waiting for a retest and rejection rather than chasing current price.)
Confirmation
Look for Bearish weekly rejection wicks, Lower timeframe lower highs, Failure to close back above 71k, Stop Loss Logic.
Above the reclaimed resistance area.
Around 73k-75k depending on entry.
Target Zones
TP1: 60k
TP2: 55k
TP3: 52k
Bullish Reversal Setup
No high-probability long setup is visible right now.
A long becomes attractive only if Bitcoin Reclaims 71k. Holds above it. Shows strong buying momentum.
Risk Warning
This analysis is based solely on the visible weekly chart and is not financial advice. Never assume any move is guaranteed. Avoid FOMO and over-leverage. Wait for confirmation instead of chasing candles. Use proper position sizing and predefined stop losses. Protect capital first; opportunities will always come later.