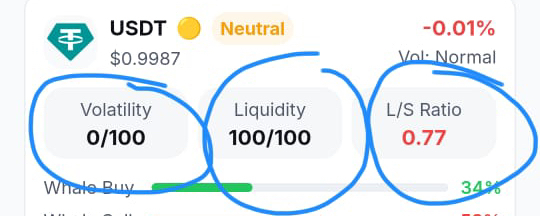

The circled metrics in crypto market screenshot are indicators used to estimate market conditions for a cryptocurrency.
1. Volatility (0/100)
Meaning: How much the price is moving up and down.
1. 0/100 = Very stable price, with almost no significant movement.
2. 100/100 = Extremely volatile, meaning the price can rise or fall sharply.
Example:
1. USDT is a stablecoin designed to stay around $1, so its volatility is usually very low.
2. Meme coins often experience very high volatility.
Trading Implication:
1. Low volatility means lower risk, but it may offer fewer trading opportunities.
2. High volatility means higher risk, but it can also create opportunities for larger profits.
2. Liquidity (100/100)
Meaning: How easy it is to buy or sell the asset without affecting its price.
1. 100/100 = Excellent liquidity, with many active buyers and sellers.
2. 0/100 = Very poor liquidity, where trades can significantly affect the price.
Example:
1. USDT and Bitcoin usually have very high liquidity.
2. Smaller altcoins may have lower liquidity.
Trading Implication:
1. High liquidity makes it easier to enter and exit trades.
2. Low liquidity can result in slippage, where your trade executes at a different price than expected.
3. L/S Ratio (Long/Short Ratio) = 0.77
Meaning: This compares traders betting on price increases (Longs) versus traders betting on price decreases (Shorts).
1. Above 1.0 = More traders are bullish and expect the price to rise.
2. Below 1.0 = More traders are bearish and expect the price to fall.
For 0.77:
1. There are more short positions than long positions.
2. Market sentiment is slightly bearish.
Example:
1. L/S Ratio = 2.0 means there are twice as many longs as shorts.
2. L/S Ratio = 0.5 means there are twice as many shorts as longs.
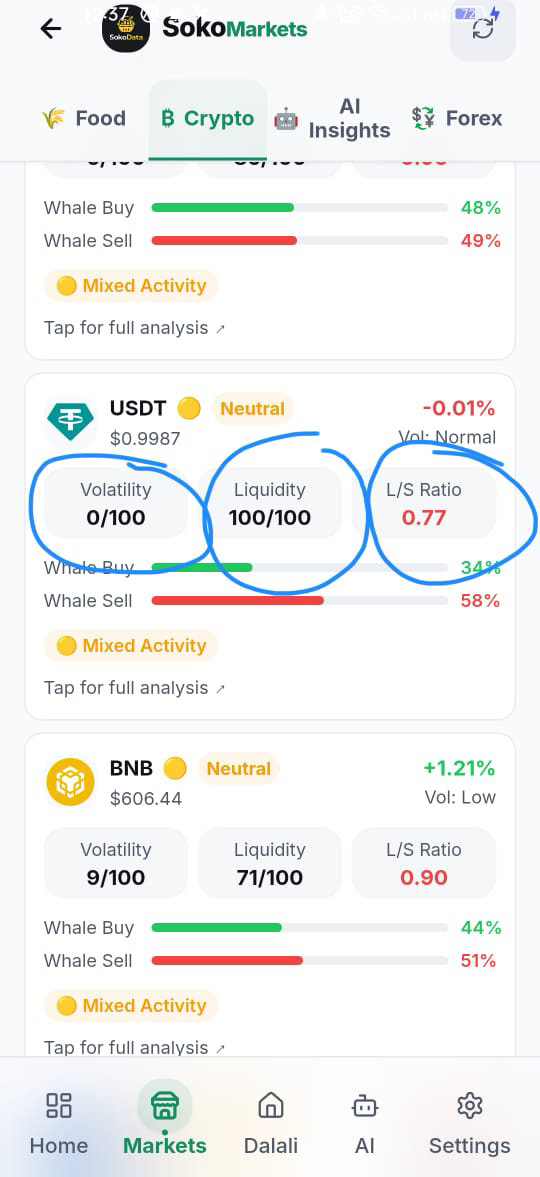
Other terms visible on the screen
Neutral
1. The system does not currently detect a strong bullish or bearish trend.
Whale Buy (34%)
1. This shows the percentage of large traders, often called “whales,” who are buying the asset.
Whale Sell (58%)
1. This shows the percentage of large traders who are selling the asset.
Mixed Activity
1. Buying and selling signals are conflicting, so there is no clear market direction at the moment.
Vol: Normal / Low
Trading Volume Level:
1. High = Strong market participation.
2. Normal = Average trading activity.
3. Low = Fewer traders are active in the market.
USDT Example
1. Volatility: 0/100 → Very stable.
2. Liquidity: 100/100 → Extremely easy to trade.
3. L/S Ratio: 0.77 → Slightly more bearish traders than bullish traders.
4. Whale Buy: 34%.
5. Whale Sell: 58%.
6. Overall Signal: Neutral / Mixed Activity.
This makes sense because USDT is a stablecoin. Most traders use it as a store of value or as a trading pair when moving between different cryptocurrencies, rather than expecting its price to rise significantly.