📊 Market Context (Very Important)
Trend: Short-term bearish correction after a strong impulse up
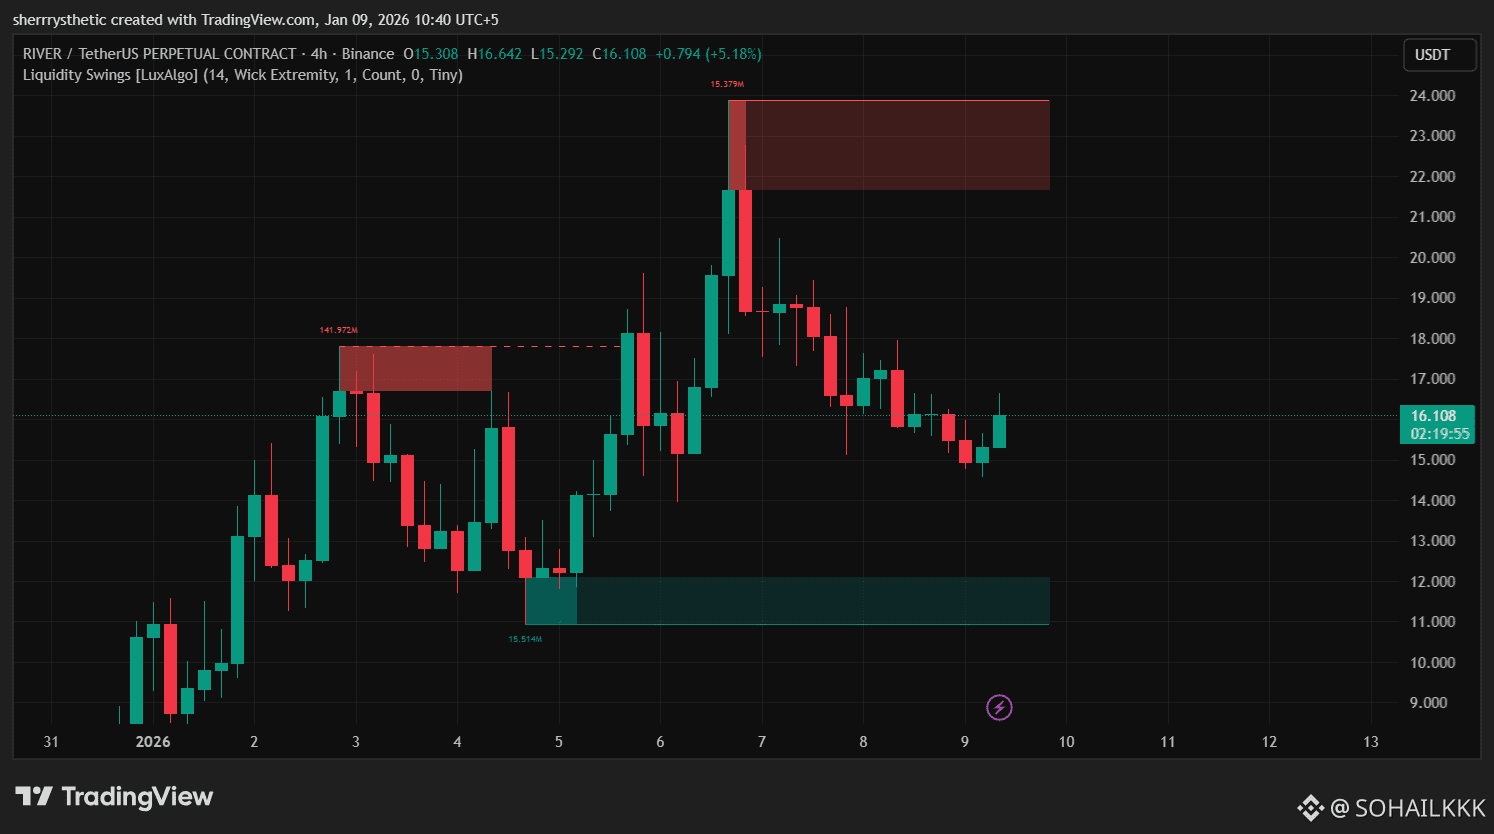
Current price: ~16.1
State: Price is between liquidity zones → indecision & choppy
Big players already distributed near the highs and price is now bleeding slowly → classic post-distribution behavior.
🔴 Sell-Side Liquidity (SHORT Zone)
📍 Upper red zone: ~22.5 – 24
Meaning:
This is a liquidity grab / distribution zone
Strong rejection already happened
Smart money sold here
💡 Trade Plan (SHORT):
👉 Only if price revisits this zone
Entry: 22.5 – 23.5
Stop-loss: Above 24.5
Target:
TP1: 18
TP2: 15.5
TP3 (runner): 12
🧠 This is a high-RR short, not a FOMO trade.
🟢 Buy-Side Liquidity (LONG Zone)
📍 Lower green zone: ~11 – 12
Meaning:
Strong previous demand
Liquidity sweep zone
Likely place where shorts will take profit
💡 Trade Plan (LONG):
👉 Wait for price to come here first
Entry: 11.5 – 12
Confirmation: Long wicks / bullish 4H close
Stop-loss: Below 10.5
Target:
TP1: 15
TP2: 18
TP3: 21+
🧠 This is where smart money reloads, not retail.
⚠️ What NOT To Do Right Now
❌ Don’t long at 16 → middle of the range = trader’s graveyard
❌ Don’t short blindly here → no liquidity resting
❌ Don’t overtrade → let price come to you
🧠 Best Strategy Based on This Chart
✅ 2 Valid Trades Only
Short at upper red zone
Long at lower green zone
Anything in between is noise.
🔑 Trading Psychology Tip (Important)
This chart tests patience, not strategy.
Most traders lose here because they feel:
“Price is moving… I must trade.”
Smart traders wait for where others are forced to trade (liquidation zones).