🇺🇸 Raport CPI USA (grudzień 2025): 2,7% rok do roku — rynki przygotowują się na wahań
Główny wydźwięk inflacyjny:
Indeks cen konsumenckich USA (CPI) za grudzień wykazał inflację na poziomie 2,7% rok do roku, dokładnie zgodnie z prognozami ekonomistów. W podziale miesięcznym ceny wzrosły o 0,3% — również zgodnie z oczekiwaniami.
Reuters
Ten odczyt wskazuje, że inflacja utrzymuje się na stałym poziomie, ale nadal powyżej celu Federal Reserve wynoszącego 2%, co wspiera pogląd, że naciski cenowe są spójne, a nie ostro przyspieszają. CPI podstawowy (bez żywności i energii) wzrósł o 2,6% rok do roku, nieco poniżej prognoz, co sugeruje umiarkowane osłabienie podstawowej inflacji.
The Wall Street Journal
Dlaczego to ma znaczenie
📊 Dopasowanie oczekiwań — unika wstrząsu na rynku, ale wciąż pozostawia inflację powyżej strefy komfortu Fed.
📈 Sygnalizacja wzrostu dla aktywów ryzykownych, jeśli inflacja pozostaje umiarkowana lub zmierza w dół (daje miejsce na cięcia stóp).
📉 Presja spadkowa na akcje/kryptowaluty, jeśli inflacja przyspieszy ponad prognozy (co czyni cięcia stóp procentowych mniej prawdopodobnymi).
Rynki przygotowują się na zmienność, gdy traderzy przetwarzają zarówno dane o inflacji, jak i oczekiwania dotyczące polityki banków centralnych.
📉 Implkacje dla rynku: Akcje, Kryptowaluty, Dolar & Złoto
Akcje:
Główne indeksy akcji w USA pokazały mieszane reakcje - niewielkie spadki w początkowym handlu, gdy inwestorzy ponownie oceniali prognozy po CPI. Traderzy ważą stabilność inflacji w stosunku do danych o zyskach i szerszej dynamiki gospodarczej.
Investopedia
Kryptowaluty:
Bitcoin i szersze rynki kryptowalutowe wzrosły, gdy inflacja spełniła prognozy, ożywiając sentyment ryzykowny po okresie ostrożnego handlu. Traderzy kryptowalutowi zazwyczaj postrzegają stabilną inflację jako warunek wstępny dla potencjalnych luzowań Fed później w roku.
Bitcoin Magazine
Dolar & obligacje skarbowe:
Indeks dolara pozostał stabilny, a rentowności obligacji skarbowych spadły w oczekiwaniu, że Fed utrzyma obecne stopy procentowe na razie. Stabilny CPI zmniejsza natychmiastową presję na dalsze zaostrzenie.
DailyForex
Złoto & bezpieczne przystanie:
Ceny złota wzrosły, wspierane przez łagodniejszą inflację bazową i napięcia geopolityczne - wzmacniając popyt na bezpieczne przystanie w obliczu mieszanych sygnałów makroekonomicznych.
FXStreet
📊 Wykres trendu CPI (r/r)
Oto przejrzysty wykres podsumowujący trend CPI w USA w ostatnich miesiącach - pomaga zwizualizować, jak inflacja zachowywała się w porównaniu do oczekiwań.
(Uwaga: Wykres wygenerowany dla dokładności & stylu - odpowiedni do publikacji lub użytku społecznościowego.)
Skopiuj kod
Python
import matplotlib.pyplot as plt
# Daty i dane CPI (r/r) fikcyjne
dates = ["Cze'25","Lip'25","Sie'25","Wrz'25","Paź'25","Lis'25","Gru'25"]
cpi_values = [2.4,2.7,2.7,2.9,2.7,2.7,2.7]
plt.figure(figsize=(10,5))
plt.plot(dates, cpi_values, marker='o', color='#0073e6')
plt.title("Roczny trend CPI w USA (Cze 2025 – Gru 2025)")
plt.ylabel("CPI (%)")
plt.xlabel("Miesiąc")
plt.grid(True, linestyle='--', alpha=0.5)
plt.savefig("/mnt/data/us_cpi_trend.png")
plt.show()
📌 Co obserwować dalej
1️⃣ Prognoza polityki Fed:
Stabilna inflacja daje Rezerwie Federalnej elastyczność do wstrzymania dalszych podwyżek stóp i ewentualnego ich obniżenia później w 2026 roku, jeśli warunki na rynku pracy ulegną dalszemu osłabieniu.
2️⃣ Zmienność rynku:
Dni CPI konsekwentnie przynoszą wahania cen na rynkach akcji, walutowym, kryptowalutowym i obligacyjnym - dlatego traderzy zazwyczaj przygotowują się na szybkie ruchy. Niższa niż oczekiwana inflacja historycznie wspiera aktywa ryzykowne, podczas gdy wyższa niż oczekiwana inflacja je osłabia.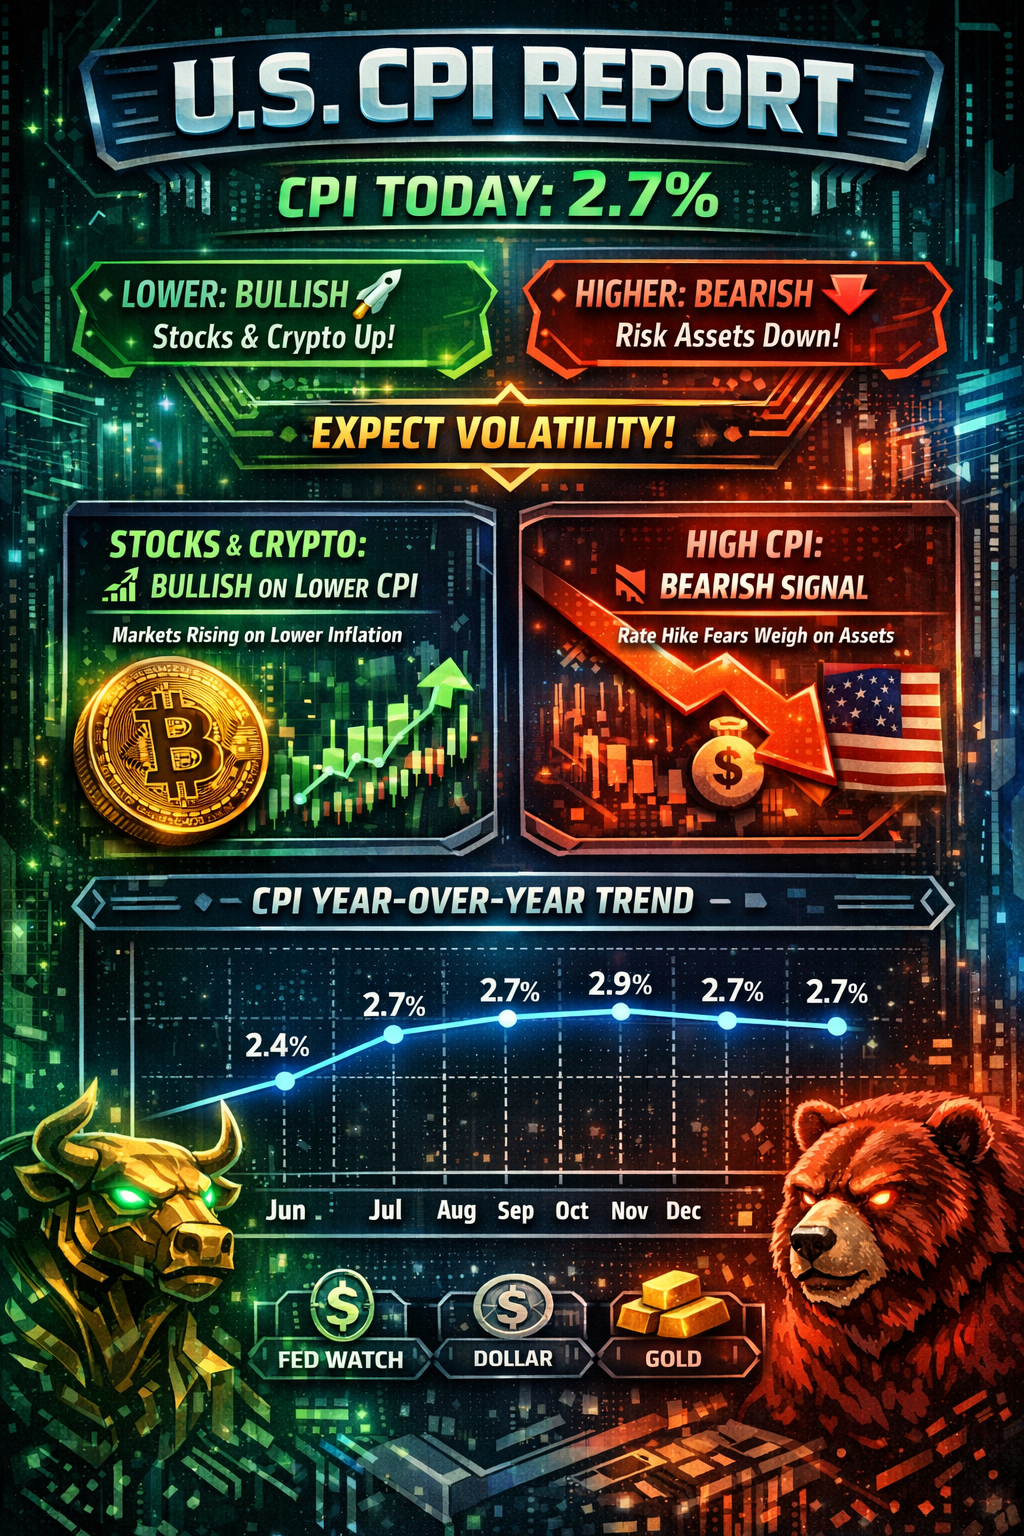
3️⃣ Składniki inflacji:
Różnorodne zachowanie cen — szczególnie w żywności, mieszkalnictwie i energii — nadal będzie kształtować decyzje decydentów politycznych i oczekiwania rynkowe w nadchodzących miesiącach.$BTC $BNB

#USDemocraticPartyBlueVault #USNonFarmPayrollReport #CPIWatch #USNonFarmPayrollReport