$BTC Bitcoin just punched through a textbook ascending triangle pattern on the 8-hour chart with serious volume backing it up. Traders are now watching whether BTC can push past $100K and hold the breakout zone as support.
👉 Bitcoin (BTC) broke out above a clean ascending triangle formation on the 8-hour timeframe, clearing the $94,000 resistance level that had been capping price for weeks. The pattern showed BTC grinding higher along an upward trendline while repeatedly testing the same ceiling—classic compression before a breakout. When price finally cracked through that horizontal resistance, it didn't look back.
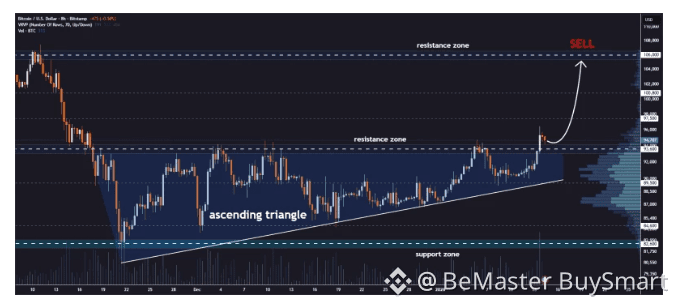
👉 Volume spiked during the breakout, which is exactly what you want to see for confirmation. Before the move, Bitcoin was printing higher lows while sellers kept defending the top—showing buyers were getting stronger each time. Once that resistance broke, price jumped into the mid-$90K range, hitting zones where previous volume and liquidity had clustered.
👉 The chart points to near-term targets at $97,500, then $100,800, and a bigger resistance zone around $106,000. These levels line up with old supply areas and heavy volume regions from past action. For support, the old resistance near $93,500-$94,000 should now flip to hold buyers, with deeper support sitting around $82,500-$84,000 where the triangle's lower boundary was.
👉 Ascending triangle breakouts usually mean the trend keeps going rather than reversing—especially when volume backs them up like this. Whether Bitcoin can stay above that former resistance matters a lot as it approaches $100K. How price reacts at that psychological level will likely set the tone for volatility and positioning across the entire crypto market in the short term.
🚀🚀🚀 FOLLOW BE_MASTER BUY_SMART 💰💰💰
Appreciate the work. 😍 Thank You. 👍 FOLLOW BeMaster BuySmart 🚀 TO FIND OUT MORE $$$$$ 🤩 BE MASTER BUY SMART 💰🤩
🚀🚀🚀 PLEASE CLICK FOLLOW BE MASTER BUY SMART - Thank You.
