Analiza wykresu dziennego BTC – Kluczowe poziomy do obserwacji
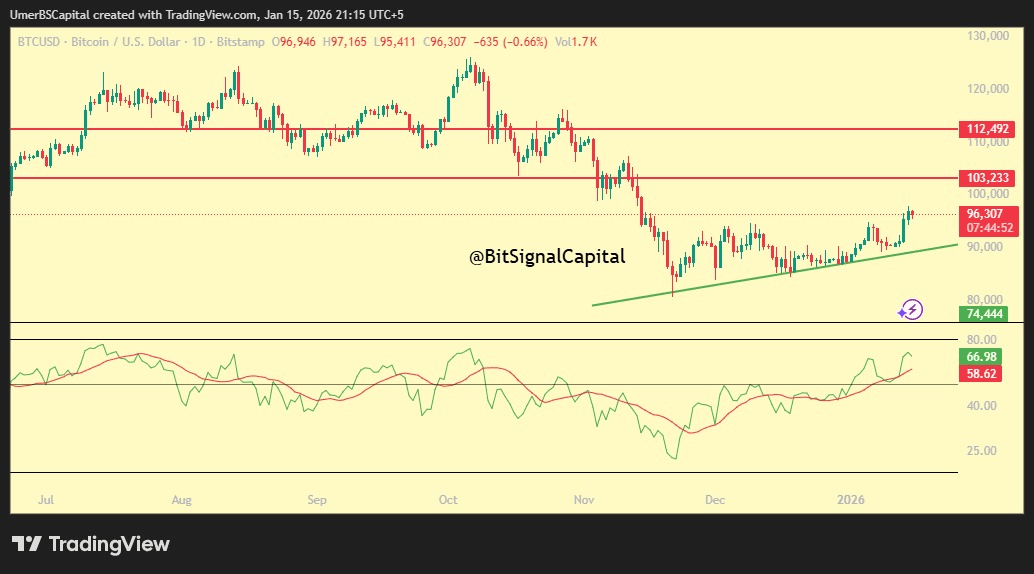
Bitcoin obecnie notuje się w kluczowej strefie na wykresie dziennym po silnym odrzuceniu od poziomu 126 000 i kolejnym odzyskaniu z poziomu 80 600.
Struktura rynku
BTC przechodzi od fazy korygującej do potencjalnej strefy ponownego nabywania. Jednak potwierdzony kontynuacji w kierunku wzrostowym jeszcze nie został ustalony.
Strefa oporu
102 000 – 103 000
Ten obszar wcześniej działał jako silny opór i wywołał ostre odrzucenie. Bez znaczącego wzrostu objętości, ta strefa prawdopodobnie ograniczy krótkoterminowy wzrost.
Strefa wsparcia
93,500 – 94,000
To jest strefa popytu o wysokim prawdopodobieństwie, utworzona przez wcześniejszą konsolidację i wsparcie strukturalne. Cofnięcie się do tej strefy byłoby uważane za zdrowe, pod warunkiem, że codzienne zamknięcia pozostaną powyżej.
Wgląd w momentum
Codzienny RSI jest blisko 67, co wskazuje na spowolnienie byczego momentum, ale nie na warunki wykupienia. Wspiera to prawdopodobieństwo korekty przed jakąkolwiek kontynuacją.
Perspektywy
Jeśli 93,5k się utrzyma: potencjalna kontynuacja w kierunku 108k i 113k
Jeśli 93k zawiedzie przy codziennym zamknięciu: ryzyko w dół w kierunku 88k – 80.6k
Kluczowe wnioski: Kierunek zostanie określony przez reakcję ceny na wsparcie, a nie przez prognozy.