$ETH Ethereum:As of mid-January 2026, Ethereum (ETH) has shown a strong start to the year, displaying a resilient recovery from its late-2025 consolidation. Below is a short analysis and a candlestick chart representing its price action for the month.
Ethereum (ETH) Market Analysis: January 2026
Price Performance: Ethereum began 2026 trading at approximately \$2,967. As of January 16, 2026, it is trading around \$3,313, marking a year-to-date gain of roughly 11.7\%.
Key Breakout: A significant turning point occurred on January 14, 2026, when ETH surged over 7\% in a single day, breaking through the critical 100-day moving average resistance. This move shifted the short-term sentiment from neutral to bullish.
Technical Levels:
Resistance: The immediate upside target for bulls is \$3,544. A sustained break above this could pave the way for a test of the psychological \$4,100 level.
Support: Strong support has formed in the \$3,075 - \$3,100 range. Analysts suggest that as long as ETH stays above the \$2,850 mark, the medium-term uptrend remains intact.
Sentiment and Risk: Market data indicates a relatively high leverage ratio (approx. 0.60), suggesting a high appetite for risk. While this often precedes significant rallies (potentially targeting 10\text{--}25\% upside), it also introduces the risk of "liquidation wicks"—sharp, temporary price dips that flush out over-leveraged positions before continuing the trend.
Long-term Outlook: ETH continues to trade within a multi-year ascending triangle pattern. If it successfully breaks and holds above the \$4,100 resistance later this year, technical projections suggest targets as high as \$5,500 to \$6,000.
Ethereum Candlestick Chart (January 1–16, 2026)
The following chart illustrates the daily price movements of Ethereum in USD for the first half of January 2026.
The historical data used to generate this analysis and chart has been saved for your
Reference: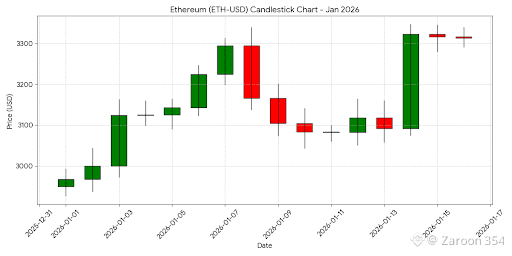 #CPIWatch #BinanceHODLerBREV #MarketRebound #WriteToEarnUpgrade #ethereum
