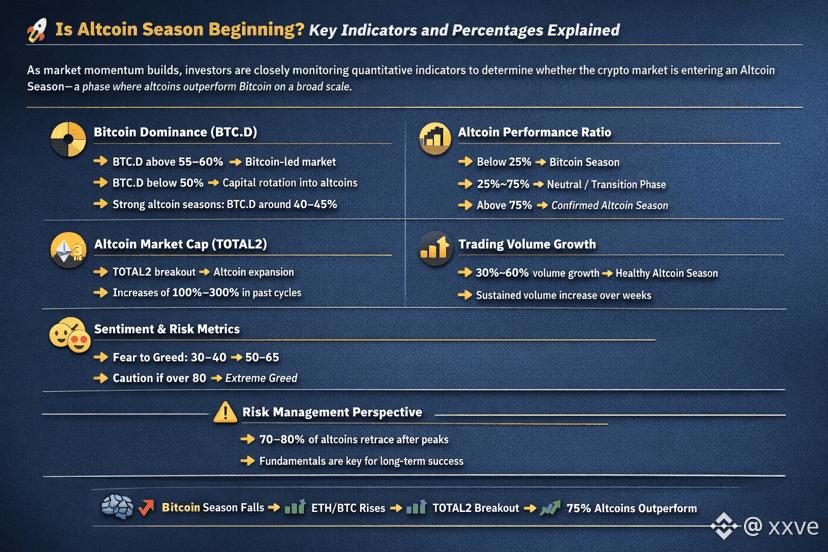
As market momentum builds, investors are closely monitoring quantitative indicators to determine whether the crypto market is entering an Altcoin Season—a phase where altcoins outperform Bitcoin on a broad scale.
Below are the most reliable indicators, supported by historical data and percentage rangescommonly used by professional analysts.
⸻
📊 Core Indicators of Altcoin Season
1️⃣ Bitcoin Dominance (BTC.D)
Definition:
#bitcoin Dominance measures Bitcoin’s share of the total crypto market capitalization.
📉 Historical Insight:
• $BTC BTC dominance above 55–60% → Bitcoin-led market
• #BTC☀ dominance below 50% → Capital rotation into altcoins
• Strong altcoin seasons historically occurred when BTC.D fell toward 40–45%
🔍 Interpretation:
A sustained decline of 5–10 percentage points in BTC dominance often precedes major altcoin rallies.
⸻
2️⃣ Altcoin Market Cap (TOTAL2)
Definition:
TOTAL2 represents the total market capitalization of all cryptocurrencies excluding Bitcoin.
📈 Historical Insight:
• Altcoin seasons often begin when TOTAL2 breaks key resistance levels
• Previous cycles saw TOTAL2 increase by 100%–300% during full altcoin expansions
🔍 Interpretation:
Higher highs and higher lows in TOTAL2 confirm structural strength in the altcoin market.
⸻
3️⃣ Ethereum vs Bitcoin (ETH/BTC)
Definition:
$ETH /$BTC measures Ethereum’s performance relative to Bitcoin.
📊 Historical Insight:
• ETH/BTC rising by 15–30% over a short period often signals the start of altcoin momentum
• Major altcoin seasons historically followed ETH/BTC trend reversals from long-term lows
🔥 Why it matters:
Ethereum typically leads altcoin cycles—when ETH outperforms BTC, capital usually flows into smaller altcoins next.
⸻
4️⃣ Altcoin Performance Ratio (Altcoin Index)
Definition:
Measures how many of the top 50–100 altcoins outperform Bitcoin over a given period.
📈 Historical Thresholds:
• Below 25% → Bitcoin Season
• Between 25%–75% → Neutral / Transition Phase
• Above 75% → Confirmed Altcoin Season
🧠 Binance-style rule:
If 75% or more of top altcoins outperform Bitcoin over 90 days, the market is considered in Altcoin Season.
⸻
5️⃣ Trading Volume Growth
Definition:
Measures liquidity inflow into altcoins across exchanges.
📊 Historical Insight:
• Healthy altcoin seasons show 30–60% volume growth across multiple altcoins
• Volume expansion must persist for several weeks, not days
💧 Volume confirms price trends.
⸻
6️⃣ Market Sentiment & Risk Appetite
Indicators Used:
• Fear & Greed Index
• Social engagement metrics
• Search trend growth
📈 Historical Patterns:
• Altcoin seasons often begin when sentiment moves from Fear (30–40) to Neutral/Greed (50–65)
• Extreme greed (80+) often marks late-stage cycles
⸻
⚠️ Risk Management Perspective
Despite strong indicators, historical data shows that:
• Up to 70–80% of altcoins retrace heavily after peak cycles
• Projects without strong fundamentals often fail to recover
📌 Risk management and profit-taking remain essential.
⸻
🧠 Conclusion
Historically, Altcoin Season begins when multiple indicators align simultaneously, including:
• Falling Bitcoin dominance
• Rising ETH/BTC
• TOTAL2 market cap expansion
• Majority of altcoins outperforming Bitcoin
While indicators may suggest early-stage conditions, confirmation requires sustained performance over time.