Triple Zig-Zag Analysis
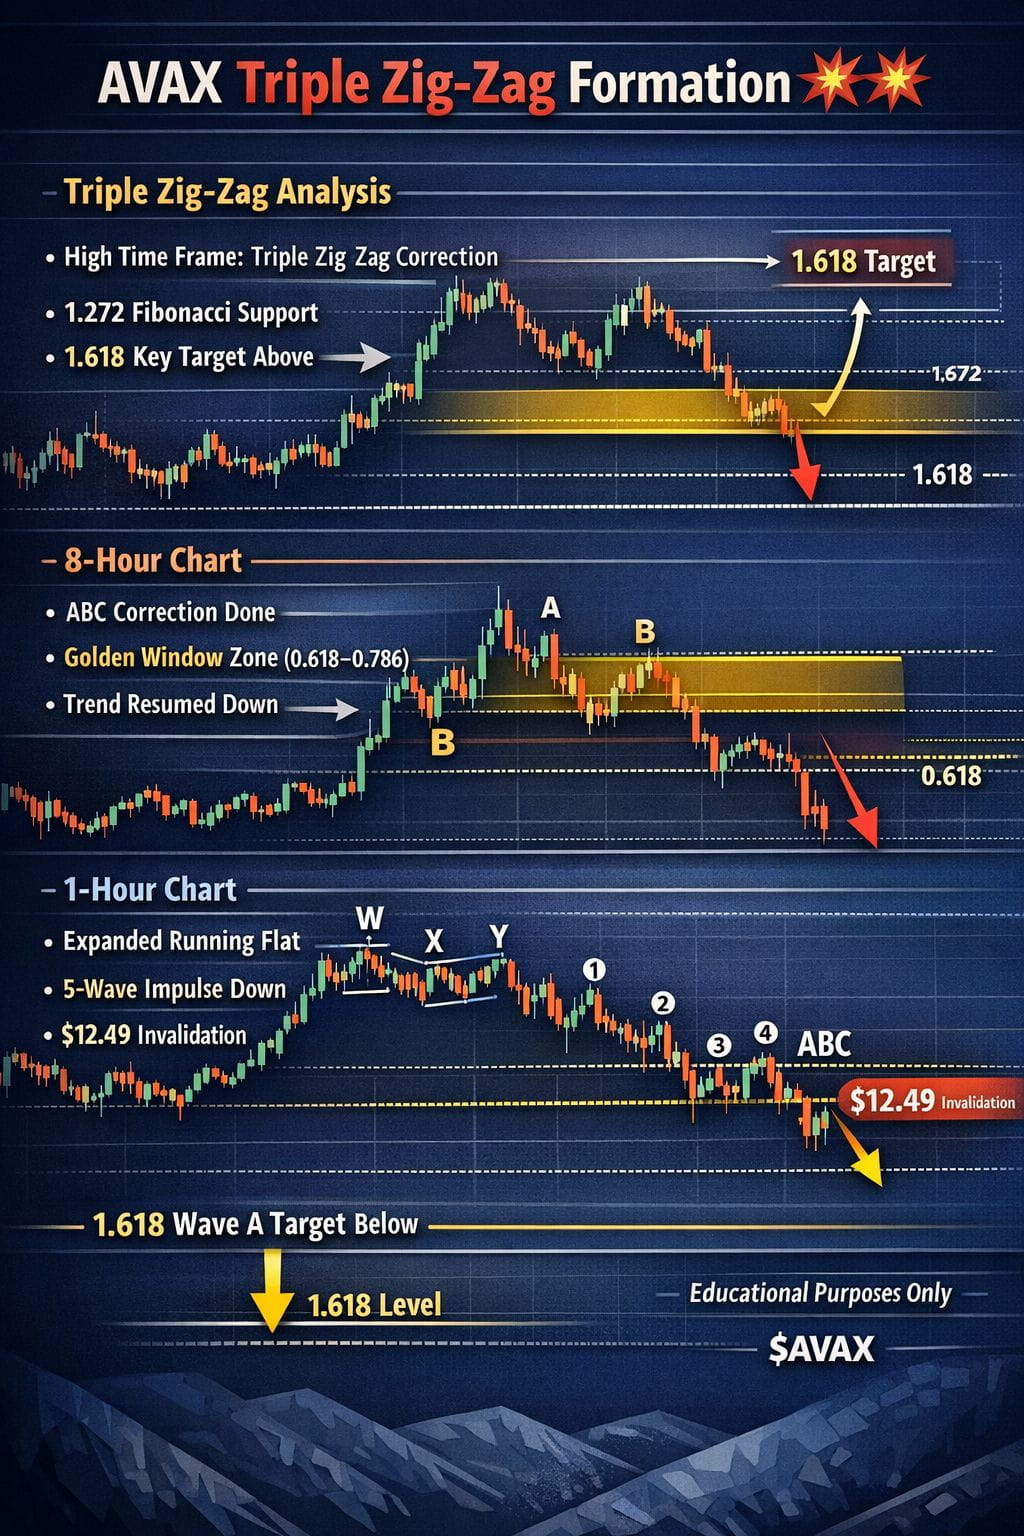
On the higher time frame, $AVAX appears to be forming a triple zig-zag correction. After analyzing the lower time frames more closely, smaller fractals of this correction can also be observed, confirming lower-degree structures within the larger pattern.
Currently, price action is holding support around the 1.272 Fibonacci pocket, which could potentially lead to a short-term reversal. However, the 1.618 level (Wave “W” × 0.618) is generally considered a more favored and reliable target above the 1.272 zone.
At the same time, there are subtle signs on the lower time frame suggesting that the market may still be developing another fractal of this corrective structure.
8-Hour Chart Analysis
On the 8-hour chart, an ABC correction has already completed, after which price turned impulsive to the downside. This move suggests that the dominant trend has resumed.
Price is currently trading within the Golden Window (0.618–0.786 retracement) of wave B and is also positioned in a high-liquidity zone. The key question now is whether this move represents a shakeout leading to a reversal or a continuation of the existing downtrend. 👇👇👇

1-Hour Chart Analysis
On the 1-hour chart, an exotic expanded running flat has formed, which may have marked wave 2 or wave B of a higher-degree structure.
Following this, price printed a clean five-wave impulse to the downside, with a truncated fifth wave, and was then followed by an ABC corrective move to the upside.
This suggests that price may currently be in the middle of a zig-zag correction, and the market is waiting for confirmation of wave 2 before a potential continuation of the five-wave impulse to the downside.
The invalidation level is $12.49. A sustained move above this level would indicate that the higher time frame triple zig-zag correction may already be complete at the 1.272 level of wave “W”. 👇👇👇
If price action continues to the downside, the 1.618 retracement of wave A is a commonly respected and strong target zone.
While the 1.272 retracement level on the 1-hour chart is also a possible reaction area, it is statistically less significant compared to the 1.618 level.